
Introduction
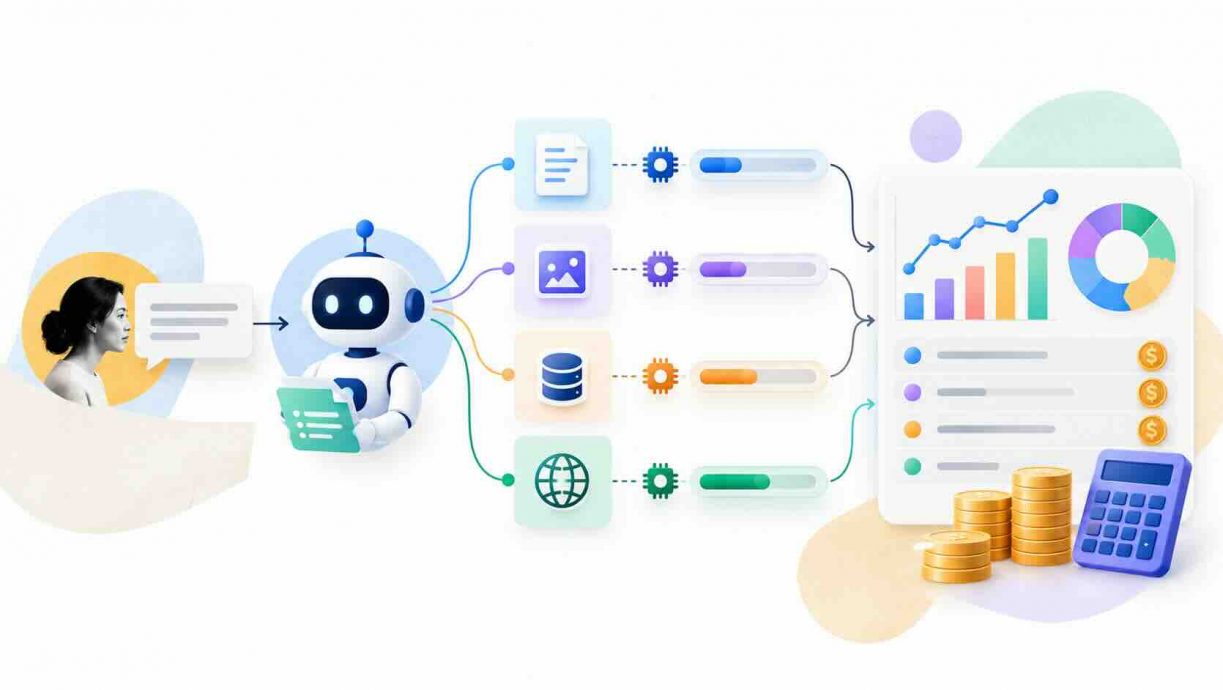
Agent cost per task measurement is the practice of tracing every dollar an AI agent spends and dividing that spend by the work it actually finished. Teams that skip it learn the truth from an invoice, and Gartner predicts that over 40 percent of agentic AI projects will be canceled by the end of 2027. The cited reasons are escalating costs, unclear business value, and weak risk controls. The trap is that a per-token price looks cheap while an agent quietly multiplies the number of tokens behind each result. Anthropic reported that agents typically use about four times more tokens than chat interactions, and that multi-agent systems use about fifteen times more. One customer request can therefore trigger dozens of model calls, retries, and tool invocations that no price sheet shows you. This guide walks from fundamentals to advanced practice, covering task definitions, formulas, tracing, evaluation, and budgets that hold under load. You will also find an interactive calculator, a runnable cost ledger, and dated case studies that show where measurement helped and where it misled.
Quick Answers on Agent Cost Per Task Measurement
What is agent cost per task measurement?
This practice traces every model call, tool call, and retry behind one agent task, converts usage to dollars, and divides by tasks completed. The result is a budgetable cost for finished work.
How do you calculate cost per task for an AI agent?
Add input, output, cached, and tool costs across every attempt, then divide by successful tasks. Equivalently, cost per solved task equals attempt cost divided by success probability, plus cleanup cost for errors that escape checks.
Why is cost per token not enough for agents?
Agents multiply tokens through loops, retries, and growing context, so identical per-token prices produce very different bills. Cost per task captures that multiplication and ties spend to finished work.
Key Takeaways
- Price per token is an input price; cost per resolved task is the output metric that finance, product, and engineering can all budget against.
- Agentic workloads commonly consume five to thirty times more tokens per task than a chatbot, so retries, loops, and resent context dominate the bill.
- Reliable measurement needs a task definition, a versioned price table, trace-level attribution, and a success check before any dollar figure is trusted.
- Cost-controlled evaluation shows that simple baselines often match complex agents at a fraction of the cost, so always report dollars next to accuracy.
Table of contents
- Introduction
- Quick Answers on Agent Cost Per Task Measurement
- Key Takeaways
- What Is Agent Cost Per Task Measurement?
- Why Cost Per Token Misleads Teams Running Agents
- The Anatomy of an Agent Task and Where Its Dollars Go
- A Formula for Agent Cost Per Task Measurement From Tokens to Dollars
- Defining a Task and Success Before You Count Anything
- Implementing Run Tracing and Cost Attribution
- Cache Hits, Retries, and Loops: The Hidden Multipliers
- Cost Per Attempt Versus Cost Per Resolved Task
- Cost-Controlled Evaluation and the Pareto Frontier
- Budgets, Alerts, and Guardrails Against Runaway Agents
- Optimization Levers: Routing, Context Discipline, and Caching
- How Vendor Pricing Models Reshape Your Cost Per Task
- Reading the Numbers Across Support, Coding, and Research Agents
- Where Cost Measurement Falls Short: Risks and Blind Spots
- Ethical Questions When Cost Becomes the Scoreboard
- The Future of Agent Cost Per Task Measurement
- How to Set Up Agent Cost Per Task Measurement in Seven Steps
- Key Insights
- Examples of Agent Cost Per Task Measurement in Practice
- Lessons From Teams That Learned Cost Discipline the Hard Way
- Common Questions About Agent Cost Per Task Measurement
What Is Agent Cost Per Task Measurement?
Agent cost per task measurement is the practice of tracing every token, tool call, and retry an AI agent consumes, converting that usage to dollars, and dividing by verified completed tasks, giving teams one honest unit for comparing agents, budgets, and pricing.
An Interactive From AIplusInfo
What does one resolved agent task really cost?
Move the controls to see how model tier, calls per task, context size, and success rate change the cost of a finished task. Each call is assumed to return 400 output tokens.
Mid tier
8
6K
75%
Cost per attempt
$0.00
All calls in one try
Cost per resolved task
$0.00
Attempt cost divided by success rate
Spend on 10,000 resolved tasks
$0
Monthly bill at that volume
Tokens per attempt
0
Input plus output
Prices are April 2026 list rates from Uptrace’s model price table. The cost-per-solved-task logic follows DoiT’s expected cost per solved task. Output is fixed at 400 tokens per call and caching is ignored.
Why Cost Per Token Misleads Teams Running Agents
Building on that definition, the first lesson is that the price per million tokens, the number every vendor advertises, is the wrong unit for judging an agent. A token price describes an input to the work, while a task describes the output the business actually pays for. Two agents billed at identical token rates can differ tenfold in total spend when one loops and resends its context while the other finishes in one pass. Readers who track cost per token trends and budgeting already know that unit prices fall, yet total spend keeps climbing. The reason is volume, because every extra step in an agent loop is another billable call. Measuring at the token level hides that multiplication, while measuring at the task level exposes it immediately.
A cheap model that needs four attempts can cost more per finished task than an expensive model that succeeds on the first try. Consider an illustrative comparison in which model A costs five cents per attempt but succeeds only 40 percent of the time. Its expected cost per solved task is five cents divided by 0.4, which equals 12.5 cents. Model B costs nine cents per attempt and succeeds 90 percent of the time, so its expected cost per solved task is exactly ten cents. The pricier model is cheaper where it counts, and the DoiT analysis of expected cost per solved task uses the same attempt-cost-over-success-probability logic. Teams that rank models by price sheet alone would choose model A and overspend by 25 percent on every solved task.
Variance is the second reason that token prices mislead budget owners. One agent task can use a few thousand tokens today and a few hundred thousand tomorrow, depending on its tool calls and carried history. That spread means an average cost per request is almost useless for budgeting, while a distribution of cost per task, with percentiles, tells you what the worst runs look like. Finance leaders need that distribution because a budget built on the mean will be blown by the tail. Measuring per task also gives product teams a number they can compare against the value of the work, which is the only comparison that ultimately matters. Once you accept the task as the unit, every later step in this guide becomes a question of how to count it correctly.
The Anatomy of an Agent Task and Where Its Dollars Go
Stepping back from the pricing debate, it helps to dissect what one agent task actually buys. A typical run begins with a system prompt and tool definitions, then alternates between planning calls, tool calls, and observation steps until a stop condition fires. Each of those steps sends the accumulated context back to the model, which is why the same instructions are billed again and again. Most runs also include retrieval, validation, and sometimes a hand-off to a human, and each of those carries its own cost. Treating the whole chain as one unit, with a single task identifier, is what makes the arithmetic honest. Without that identifier, you end up with a pile of separate model calls and no way to say what any of them accomplished.
Cisco’s guide to agent tokenomics names four areas that make up an agent’s cost lifecycle: contextual input and system prompts, reasoning loops, tool invocation overhead, and prompt caching. Contextual input is resent every turn, so growing conversation history, which Cisco calls context window creep, can become the largest hidden expense. Reasoning loops add tokens with every extra model call, so a more thorough agent costs more than a simple reactive one. Tool definitions consume tokens each time the agent considers a tool, which means the number of tools you load has a direct price. Caching sits on the other side of the ledger, because reusing stable instructions and tool definitions lowers the effective price of the same tokens.
The dollars in an agent task rarely sit where the team expects, because generating the final answer is usually the smallest line item. Planning, context, and tool overhead take most of the budget, while the visible output the user reads is a thin slice. This is why optimizing the final prompt wording seldom moves the bill, while trimming resent context often does. Good context engineering for LLM agents therefore acts as a cost control as much as a quality control. A useful exercise is to take one real trace and color every token by category, so the team can see for itself which category dominates. The answer is almost always a surprise, and it tells you where measurement and optimization effort should start.
Beyond model tokens, a full task cost includes the supporting services that wrap the model. Embedding calls, vector database queries, web search APIs, code sandboxes, and orchestration infrastructure all bill per use or per hour. Observability tooling and evaluation runs add their own overhead, and so does any human review you route work to. A complete ledger therefore has two layers: the marginal cost of the run itself and the allocated cost of the platform that makes the run possible. Start with the marginal layer because it is easy to attribute, then add allocated cost once the first layer is trustworthy. Mixing the two too early produces numbers nobody can reproduce, which erodes trust in the whole program.
A Formula for Agent Cost Per Task Measurement From Tokens to Dollars
Given the anatomy above, the core formula can be stated in plain terms. For one model call, cost equals input tokens times the input rate, plus output tokens times the output rate, with each rate divided by one million. For one attempt, you sum the calls plus any tool or service charges. For one task, you sum every attempt, including retries and abandoned branches, and divide by one when the task succeeds. Across many tasks, you divide total spend by the number of tasks that met your success definition. This formula is simple enough to compute in a spreadsheet, yet precise enough to drive budget decisions.
Caching changes the arithmetic, so the formula needs separate terms for cached tokens. According to Anthropic’s prompt caching documentation, five-minute cache writes cost 1.25 times the base input price, one-hour writes cost 2 times, and cache reads cost 0.1 times. Total input tokens are the sum of uncached input, cache creation, and cache reads, and each bucket must be priced at its own multiplier. If you charge every input token at the headline rate, you overstate cost on cache-heavy agents and miss the premium paid for cache writes. Provider usage objects report these buckets separately, so the data to do this correctly is already in every response.
Always compute cost at log time from a versioned price table, never at report time from today’s prices. Prices change, models are deprecated, and discounts expire, so a report that recomputes old traffic at new rates quietly rewrites history. Store the price table version, the model name, and the token buckets with every call, then multiply once and keep the result. Teams that follow the guidance in how to reduce LLM inference costs can then verify each saving against a stable baseline. When a provider changes a rate, you add a new table version and the old traffic keeps its original cost. Reconcile the summed ledger against the provider invoice every month, and investigate any gap larger than a few percent.
Defining a Task and Success Before You Count Anything
Turning to definitions, the most common measurement failure has nothing to do with math. It is a vague idea of what counts as one task and what counts as a success. If a support agent handles a conversation across three days and four tools, you must decide whether that is one task or several. A workable definition has four parts: a trigger, a boundary, an owner, and a success test. The trigger is the event that starts the task, and the boundary says which model calls, tool calls, and retries belong to it through a stable task identifier. The owner is the team accountable for the number, and the success test is a check that runs automatically or by sampling. Guidance on how to measure AI agent performance makes the same point, which is that quality and cost must always be reported together.
Success must be measured on your own work, with a check you trust, rather than borrowed from a vendor dashboard. The Ecorpit analysis of cost per resolved task stresses that resolution rate has to be measured on your own tickets and that containment does not count. A conversation the bot ended without escalating is not necessarily a conversation it solved, since the customer may simply have given up. Use a signal that reflects the real outcome, such as a confirmed fix, a passing test suite, or a human reviewer who agrees. When automated checks are impossible, sample a fixed percentage of runs for human review and report the sampling error beside the cost. Write the definitions into a short document that engineering, finance, and product all sign, because every later number depends on them.
Implementing Run Tracing and Cost Attribution
Moving on to plumbing, the practical foundation of agent cost tracking is one trace per task. Each model call becomes a span, each tool invocation becomes a child span, and the task identifier ties them together. OpenTelemetry’s generative AI conventions already define the attribute names, so you do not need to invent a schema. Honeycomb’s guide to tracking token cost across LLM workflows recommends emitting one event per LLM request within the same trace as retrieval and tool calls. The attributes include input and output token counts, cache read and cache creation counts, the request and response model, and the agent and conversation identifiers. Cost fields go in your own namespace, with a pricing version recorded beside them.
Business metadata matters just as much as the raw token counts do. Tag every request with the feature, environment, team, workspace, user tier, and experiment name so spend can be grouped later. Keep prompts and completions out of cost telemetry and attach them as span events that a collector can filter, because cost dashboards should never leak customer text. The same trace should also carry the outcome of the task, so success can be joined to spend without a second system. When tracing and evaluation share an identifier, you can answer questions such as which prompt version produced the cheapest successful runs. Evaluation tooling, including the approach described for evaluating Amazon Bedrock agents with RAGAS, fits naturally on top of this trace structure.
Roll cost up from child spans to the parent task span, and never trust a total that was computed anywhere else. Each model call span carries its own computed dollars, the tool spans carry theirs, and the parent span stores the sum plus the final outcome. This structure lets you slice by step, so you can see that the planning call costs more than all tool calls combined, or that one flaky tool triggers most retries. It also keeps the ledger auditable, since any total can be reproduced by summing its children. Store the roll-up as a metric as well, with a counter for cumulative spend and a histogram for cost per task, so dashboards can show percentiles without scanning raw traces.
Instrumentation should be automatic wherever possible, because manual logging decays within weeks. Use the instrumentation libraries for your model provider so token usage lands on spans without custom parsing, then add one thin wrapper that computes dollars. Make the wrapper fail loudly when a model name is missing from the price table, since a silent zero cost is the most dangerous bug in this domain. Add a daily job that compares ledger totals with invoices and alerts when the gap grows. Teams that wire these three pieces together, automatic spans, a strict price lookup, and a reconciliation job, usually have trustworthy numbers within a sprint.
Cache Hits, Retries, and Loops: The Hidden Multipliers
Looking closer at the biggest surprises, three mechanisms inflate agent bills far beyond what a single call suggests. Retries repeat work after a failure, loops repeat work while the agent searches for a way forward, and context accumulation makes every repeat larger than the last. The Kunal Ganglani analysis of AI agent cost per task notes that two retries can triple the cost of a coding session. It also estimates that a ten-turn session with a 4,000-token system prompt and 8,000 tokens of repository context reaches roughly 120,000 input tokens by the tenth call. These multipliers explain why benchmark estimates run three to five times below real-world spend.
Prompt caching is the main defense against accumulation, but only when it actually hits. Cached reads cost a fraction of normal input, so a stable prefix of instructions and tool definitions can cut the price of every later turn. A single changed token near the start of the prompt invalidates the cached prefix and silently restores full price. Tracking the cache hit rate per agent therefore belongs on the same dashboard as cost per task. The explainer on prompt caching and how to cut LLM costs covers the mechanics, and your own ledger will show whether the savings are real.
A retry is only free if you do not count it, and the ledger must count every attempt, including the ones the user never saw. Teams often log the final successful call and forget the three failed ones before it, which understates cost by the retry multiplier. Record the attempt number on every span, and report both cost per attempt and cost per task so the retry overhead is visible as its own ratio. A rising ratio of attempts to tasks is an early warning that a tool, a prompt, or a model change has hurt reliability. It often shows up in the ledger days before users complain, which makes it one of the cheapest quality signals available.
Cost Per Attempt Versus Cost Per Resolved Task
Stepping back to compare the two main metrics clarifies what each one is for. Cost per attempt measures how expensive one try is, which is useful for engineering decisions such as shortening a prompt or choosing a cheaper model. Cost per resolved task measures what the business pays for a finished outcome, which is the number to compare against human labor, customer lifetime value, or a vendor’s per-outcome price. The relationship between them is the success rate, and the simplest model says that cost per resolved task equals attempt cost divided by success probability. When failures escalate to a person, the human cost enters as well, giving a total of attempt cost plus the failure rate times the human handling cost.
A worked example makes the escalation formula much easier to see. Suppose an agent costs 20 cents per attempt, resolves 70 percent of tickets on its own, and sends the rest to a human who costs nine dollars per ticket. Expected cost per ticket is 20 cents plus 30 percent of nine dollars, which equals $2.90. Raising the resolution rate to 85 percent drops that figure to $1.55, while the 20-cent agent cost barely matters by comparison. The lesson is that once humans are in the loop, resolution rate usually moves cost more than token efficiency does. Teams should therefore spend their first optimization effort on success rate, and only then chase cheaper tokens.
Leakage, the share of bad outputs that slip past automated checks, belongs in the total because someone always pays to clean it up. The DoiT framework multiplies a leak rate by the cleanup cost of each escaped error. It shows that reliability beats token efficiency once cleanup costs more than roughly five to ten attempts. See the same logic applied in the cost per solved task discussion, which notes that its worked examples use constructed numbers. Use the idea rather than the figures, and estimate your own cleanup cost from support or engineering time. Pair the estimate with a sampled review so the leak rate is measured, not guessed. A judge model can help at scale, and the guide on how to evaluate LLM outputs with LLM-as-a-judge explains how to calibrate one.
Cost-Controlled Evaluation and the Pareto Frontier
Shifting from production traffic to evaluation, the same discipline applies to deciding which agent design to ship. The Princeton paper AI Agents That Matter argues that every agent evaluation must control for cost, and its HumanEval results show why. A simple warming baseline on GPT-4 reached 93.2 percent accuracy for $2.45 total, while LATS on GPT-4 reached 88.0 percent for $134.50. An escalation strategy that falls back to a stronger model only when needed scored 85.0 percent for just $0.27. For substantially similar accuracy, the authors found that cost can differ by almost two orders of magnitude. Plotting accuracy against dollars makes this visible, and the set of agents that nothing else beats on both axes forms the Pareto frontier. Anything off the frontier is dominated, meaning another design is both cheaper and at least as accurate.
Accuracy alone cannot show progress, because methods such as retrying can raise it without adding any scientific or practical merit. Run your own comparison the same way, using a fixed task set, several runs per configuration, and mean cost per task alongside mean accuracy. Report input and output token counts as well, so readers can recompute dollars when prices change. Include simple baselines in every comparison, such as a single strong model call, a retry loop, and a cheap-model-first escalation. If a sophisticated architecture cannot beat those on the frontier, you have saved yourself an expensive deployment. Coordination-heavy designs deserve the same scrutiny, and the notes on hierarchical coordination in multi-agent tasks are a good place to see what extra orchestration actually buys.
Budgets, Alerts, and Guardrails Against Runaway Agents
Given the measurement foundation above, the next job is to make overspending impossible rather than merely visible. A dashboard tells you about a runaway loop after the money is gone, while a budget guard stops the loop while it is still running. Build the guard in layers: a per-task cap on steps, tokens, and dollars, a per-user daily limit, and a per-team monthly ceiling. Each layer catches a different failure, from a single stuck agent to a slow drift in usage across a department. The FinOps view in FinOps for agentic AI frames these limits as shared financial controls rather than engineering afterthoughts. Agree on who is paged when a layer trips, because an alert with no owner is just noise.
A hard per-task cap is the only control that works while the loop is still running. When the cap is reached, the agent should stop cleanly, save its state, and either hand off to a human or return a partial result with a clear explanation. Set the cap from data, for example at a multiple of the 95th percentile of cost for successful tasks, so legitimate hard cases still finish. Review every capped run, because a cluster of them usually points to one broken tool or one ambiguous instruction. Capped runs are also valuable training data for your task definition, since they reveal the cases the agent cannot handle economically. Treat the cap rate as a first-class metric next to cost per task.
Alerting should watch distributions and ratios rather than only totals. Latency and error dashboards cannot tell a cheap request from an expensive one, as the Uptrace guide to LLM cost monitoring points out, so cost needs its own signals. Useful alerts include the 99th percentile cost per task, the rate of change in spend per hour, the average attempts per task, and the cache hit rate. An alert on cache hit rate often catches a prompt change that silently doubled input cost, days before the invoice would. Keep the thresholds relative to a trailing baseline so seasonal traffic does not create constant false alarms. Send each alert with a link to the offending traces so the responder can start diagnosis immediately.
Optimization Levers: Routing, Context Discipline, and Caching
Moving on to savings, the order in which you pull optimization levers matters as much as which levers you choose. The first lever is model routing, which sends easy tasks to a small model and escalates only the hard ones. Elastic notes that model costs vary roughly 5 to 30 times within one provider, so routing has a large ceiling. The risk is that a router which sends too much work to the small model lowers success rate and raises the cost of retries and human cleanup. Measure routing by cost per resolved task, never by the share of traffic sent to the cheap tier. A good router lowers that figure, while a bad one only moves cost from the model line to the human line.
The second lever is context discipline, and it is usually the biggest. Elastic cites a 2026 audit of 30 production engineering teams in which resent context alone accounted for 62 percent of the agent inference bill. Trimming that context pays off on every call of every task, so the savings compound across a long session. Practical tactics include summarizing old turns, dropping tool outputs once they are consumed, loading only the tools a step needs, and retrieving documents instead of pasting them. Elastic also reports a benchmark where context size fell by more than 40 percent while retrieval coverage held steady. Each tactic should be tested against success rate, because a context that is too thin makes the agent fail and retry.
Change one lever at a time and read the result as a change in cost per resolved task, not as a change in cost per token. Caching is the third lever, and it rewards stable prompt structure: put instructions and tool definitions first, keep them byte-identical across calls, and place volatile content last. Batch processing, where latency allows, is a fourth lever that many providers discount, though you should confirm current terms with your provider. A broader menu of tactics appears in the guide to enterprise AI cost optimization strategies. Keep a changelog of every optimization with its measured effect so the team learns which levers work on its own workload.
Finally, resist optimizing a number you have not yet decomposed. If your ledger shows that planning calls cost more than all tool calls together, no amount of tool tuning will help. If it shows that one task type accounts for most of the spend, fix that task type before touching anything else. Sorting the highest-cost runs each week is a cheap way to find these concentrations, because they often reveal retry loops or oversized context. Pair that review with the success-rate view so you never cut cost in a way that quietly cuts quality. The goal is a lower cost per resolved task at the same or better quality, and nothing less than that counts as an improvement.
How Vendor Pricing Models Reshape Your Cost Per Task
Looking at the market, vendors now price agents in at least three ways: per seat, per action, and per outcome. Per-seat pricing hides the unit cost, so you must divide the license by the tasks completed to find it. Per-action pricing is easier to model, because Salesforce states that each Agentforce action consumes 20 Flex Credits, or $0.10 per action. At that rate a task that triggers twelve actions costs $1.20 before any of your own model or integration spend. Per-outcome pricing goes further and charges only when the vendor delivers a defined result, which moves part of the success risk onto the seller. Whatever the model, your job is to convert the vendor invoice into the same cost-per-resolved-task unit as everything else.
When a vendor charges per action or per outcome, your cost per task becomes a purchasing question rather than an engineering question. Compare the vendor’s price per outcome with your fully loaded in-house figure, including build cost amortized over volume, monitoring, and human escalation. Check how the vendor defines a billable outcome, what happens to conversations that reopen, and whether a monthly cap exists. Those definitions determine whether the headline price is the price you will actually pay. The overview of how AI agent pricing is evolving tracks these shifts across vendors. Revisit the comparison every quarter, since both vendor terms and your own volumes change quickly.
Reading the Numbers Across Support, Coding, and Research Agents
Beyond a single dashboard, comparing workloads shows why one benchmark cannot serve every team. Support agents live on resolution rate and human escalation cost, so a few cents of model spend per attempt rarely decides the outcome. Coding agents live on token volume, because large repositories and test loops push context far beyond a chat. Research agents live on breadth, since parallel sub-agents and many searches multiply tokens in exchange for better coverage. Each workload therefore needs its own dominant metric, even though all three share the same underlying ledger. Teams that copy a figure from a different workload usually end up with a budget that is wrong by a large factor.
Coding offers the clearest public numbers on cost per task. The Ganglani analysis reports that on the Aider polyglot benchmark, GPT-5 with high reasoning cost about $0.129 per task at an 88 percent pass rate. That works out to about $0.147 per solved task once failures are counted. Gemini 2.5 Pro cost about $0.028 per task at a 72 percent pass rate, which works out to roughly $0.039 per solved task. The cheaper model is far less expensive per task, yet the gap narrows per solved task. The best choice depends on how costly a failed task is for your business. The same source warns that real-world sessions run three to five times above benchmark estimates because of retries, tool overhead, and accumulated context.
Cost per task benchmarks only transfer across workloads after you multiply them by a realistic overhead factor. Start from a published figure and apply the three-to-five-times multiplier as a planning assumption. Replace it with your own measured ratio once your ledger holds a month of data. Compare your ratio of actual to benchmark cost over time, because a rising ratio signals growing context or more retries. For adoption context, the roundup of agentic AI adoption statistics shows how quickly these workloads are spreading across companies. As more teams deploy agents, the gap between those who measure cost and those who guess will become a visible competitive difference.
Where Cost Measurement Falls Short: Risks and Blind Spots
Despite the value of the discipline, cost per task has real blind spots that teams should plan for. The success label is the weakest link, because a sloppy check inflates the denominator and makes the agent look cheaper than it is. The Holistic Agent Leaderboard study found that on failed tasks in two benchmarks, agents violated a benchmark instruction in their final answer over 60 percent of the time. If your success test only checks that an answer exists, those failures could be counted as wins. Stale price tables, unattributed shared infrastructure, and sampling error in human review add further noise. Report an uncertainty range with the headline number rather than a falsely precise single figure.
Any metric that becomes a target will be gamed, and cost per task is no exception. Engineers under pressure to lower the number can cut context until answers degrade, raise the cap until failures are hidden, or reclassify hard tasks as out of scope. Defend against this by always pairing cost with a quality measure, reviewing a random sample of cheap runs, and tracking downstream signals such as reopened tickets. Deterministic checks help here, and the approach described in deterministic guardrails for AI agents gives a way to make success tests harder to fool. Finally, remember that cost per task cannot measure value you failed to define, so keep a separate view of business outcomes.
Ethical Questions When Cost Becomes the Scoreboard
Beyond the technical risks, a cost-first scoreboard raises ethical questions about who absorbs the savings and who absorbs the damage. When an agent is judged mainly on spend, the pressure is to resolve fewer conversations well and more conversations cheaply. Customers experience that pressure as slower help, repeated questions, or a dead end with no path to a person. Klarna’s chief executive told the press that cost had become a too predominant evaluation factor that led to lower quality. The lesson for measurement programs is to publish quality targets that carry the same weight as cost targets. A scoreboard that shows only dollars teaches the organization to chase dollars.
Customers should always be able to reach a human, and the cost model should price that guarantee in rather than treat it as a failure. Escalations are not leaks in the system; they are a safety feature with a real cost, and honest accounting includes them. The same CEO stressed that customers should know there will always be a human if they want one. Workers are affected too, since cost-per-task comparisons are often used to justify headcount decisions, as discussed in the piece on AI agents and job replacement concerns. Share the methodology openly with the people whose jobs are measured against the agent, and let them challenge the assumptions. A number that employees cannot inspect is hard to trust and easy to misuse.
Privacy deserves equal attention, because the telemetry that powers cost measurement can also leak sensitive text. Keep prompts and completions out of the cost pipeline by default, and store them only in a separate, access-controlled system with a short retention period. Log identifiers and token counts rather than content, and hash user identifiers when you attribute spend to individuals. Be transparent with customers about when they are talking to an automated system and how their data is used. These practices cost little, and they prevent the kind of incident that would erase years of measured savings in a single headline.
The Future of Agent Cost Per Task Measurement
Looking ahead, the central tension is that unit prices keep falling while tokens per task keep rising. Cisco notes that the cost per million tokens for standard models has dropped by over 99 percent recently. It adds that reasoning models are expected to push overall inference costs up. It also cites Gartner’s estimate that agentic models may need five to thirty times more tokens per task than a standard chatbot. Cheaper tokens will therefore not make measurement obsolete; they will make it more necessary, because small per-call savings are overwhelmed by growing call counts. Teams that wait for prices to solve the problem will keep meeting the same invoice surprises.
The unit price of intelligence will keep falling, but the number of units each task consumes will keep rising. Expect three shifts over the next few years: standardized telemetry, outcome-based contracts, and cost-aware agents. OpenTelemetry’s generative AI conventions are converging on shared attribute names for usage, models, and agents, which will let cost tooling work across frameworks without custom glue. Outcome-based pricing will push vendors to publish clearer definitions of a resolved task, and buyers to audit them. Agents themselves will receive their remaining budget as an input and choose cheaper strategies when it runs low. Linking all of this to financial results is the subject of measuring ROI on AI investments, which is where cost per task finally meets business value.
Chart From AIplusInfo
Similar accuracy, wildly different bills
Total cost in US dollars to run each coding agent on the 164 HumanEval problems (mean of five runs).
Simple baselineComplex agent architecture
Source: Kapoor et al., AI Agents That Matter, Table A1. Cost per solved problem is an AIplusInfo calculation: total cost divided by accuracy times 164 problems.
How to Set Up Agent Cost Per Task Measurement in Seven Steps
Step 1 - Write the task contract
Building on the definitions earlier in this guide, start by writing a task contract that every service can read. The contract names the task type, the trigger event, the owner, the boundary of what belongs to one task, and the success test. Keep it in version control beside the agent code so changes to the definition are reviewed like any other change. Include a maximum budget in dollars, steps, and tokens, because the same file will drive the guard you build in Step 7. Store a version string so each ledger row records which contract produced it. A small file like the one below is enough to begin.
# task_contract.yaml
task_type: support_ticket_resolution
version: 3
trigger: ticket.created
owner: support-platform-team
boundary:
  includes: [model_calls, tool_calls, retrieval, retries, human_review]
  task_id_field: ticket_id
success_test:
  kind: confirmed_by_customer_or_reviewer
  sample_rate_for_human_review: 0.05
budget:
  max_dollars: 2.50
  max_steps: 25
  max_tokens: 400000
Step 2 - Build a versioned price table
Next, create a price table that lives in code and carries its own version string. Prices are quoted per 1 million tokens, and each model has separate rates for input, output, cache reads, and cache writes. The rates below are placeholders for illustration, so load the real numbers from your provider's pricing page and record the date you copied them. When a provider changes a price, add a new table version rather than editing the old one. This keeps historical ledger rows reproducible and lets you explain any month-over-month change in cost per task. Treat a missing model name as an error, because a silent zero is the most expensive bug in this domain.
# prices.py
PRICE_TABLE = {
    "version": "2026-10-01",
    "models": {
        "small-model":    {"input": 0.20, "output": 1.25, "cache_read": 0.02, "cache_write": 0.25},
        "mid-model":      {"input": 1.25, "output": 10.00, "cache_read": 0.125, "cache_write": 1.5625},
        "frontier-model": {"input": 3.00, "output": 15.00, "cache_read": 0.30, "cache_write": 3.75},
    },
}
Step 3 - Capture usage with tracing
With prices in place, instrument the agent so that every model call and tool call becomes a span inside one trace per task. Install the OpenTelemetry SDK and an exporter, then initialize a tracer provider once at startup. The OpenTelemetry generative AI semantic conventions define attribute names for token usage, the request model, and agent identity. Use those names so any backend can read your data without translation. Add your own attributes for dollars and the pricing version, and attach business tags such as feature, team, and environment. A typical agent produces between 5 and 40 model-call spans per task, so keep the attributes on each span lean.
pip install opentelemetry-sdk opentelemetry-exporter-otlp# tracing.py
from opentelemetry import trace
from opentelemetry.sdk.trace import TracerProvider
from opentelemetry.sdk.trace.export import BatchSpanProcessor
from opentelemetry.exporter.otlp.proto.http.trace_exporter import OTLPSpanExporter
provider = TracerProvider()
provider.add_span_processor(BatchSpanProcessor(OTLPSpanExporter()))
trace.set_tracer_provider(provider)
tracer = trace.get_tracer("agent.cost")
def record_usage(span, model, usage, cost_usd, price_version):
span.set_attribute("gen_ai.request.model", model)
span.set_attribute("gen_ai.usage.input_tokens", usage["input"])
span.set_attribute("gen_ai.usage.output_tokens", usage["output"])
span.set_attribute("gen_ai.usage.cache_read_input_tokens", usage.get("cache_read", 0))
span.set_attribute("gen_ai.usage.cache_creation_input_tokens", usage.get("cache_write", 0))
span.set_attribute("llm.request_cost_usd", cost_usd)
span.set_attribute("llm.pricing_version", price_version)Step 4 - Compute dollars at log time
Now write the function that converts a usage object into dollars. It multiplies each token bucket by its own rate and divides by one million, which is where the cache multipliers from earlier come into play. Call it immediately after each response so the dollar figure is frozen with the price version that was current. Raise an error for unknown models instead of defaulting to zero. Unit-test the function with at least 3 hand-calculated cases, including a cache-heavy call, because errors here silently corrupt every later report. A useful habit is to round only when displaying and never when storing, so tiny per-call costs do not vanish.
# cost.py
from prices import PRICE_TABLE

def call_cost(model, usage):
    rates = PRICE_TABLE["models"][model]  # KeyError on unknown model is intentional
    total = (
        usage.get("input", 0) * rates["input"]
        + usage.get("output", 0) * rates["output"]
        + usage.get("cache_read", 0) * rates["cache_read"]
        + usage.get("cache_write", 0) * rates["cache_write"]
    ) / 1_000_000
    return total

if __name__ == "__main__":
    sample = {"input": 12000, "output": 800, "cache_read": 30000, "cache_write": 0}
    print(round(call_cost("mid-model", sample), 6))
Step 5 - Roll costs up to the task and record the outcome
After individual calls are priced, accumulate them on a task ledger that carries the task identifier from the contract. The ledger adds the cost of every attempt, counts attempts and tool calls, and stores the final outcome when the task ends. Write one JSON line per finished task to a durable store so analytics can read it without scanning raw traces. Record the contract version and price version alongside the totals. Use 4 outcome values: resolved, failed, escalated, and capped. Include capped or abandoned tasks too, with a failed outcome, because leaving them out makes cost per resolved task look better than it is.
# ledger.py
import json, time
from cost import call_cost
from prices import PRICE_TABLE

class TaskLedger:
    def __init__(self, task_id, task_type, contract_version):
        self.task_id = task_id
        self.task_type = task_type
        self.contract_version = contract_version
        self.cost = 0.0
        self.calls = 0
        self.attempts = 1
        self.started = time.time()

    def add_call(self, model, usage):
        c = call_cost(model, usage)
        self.cost += c
        self.calls += 1
        return c

    def retry(self):
        self.attempts += 1

    def finish(self, outcome, path="task_costs.jsonl"):
        row = {
            "task_id": self.task_id,
            "task_type": self.task_type,
            "contract_version": self.contract_version,
            "price_version": PRICE_TABLE["version"],
            "cost_usd": round(self.cost, 6),
            "calls": self.calls,
            "attempts": self.attempts,
            "outcome": outcome,  # resolved | failed | escalated | capped
            "seconds": round(time.time() - self.started, 2),
        }
        with open(path, "a") as f:
            f.write(json.dumps(row) + "\n")
        return row
Step 6 - Report cost per resolved task with percentiles
Once rows accumulate, load them into a warehouse table and report the metrics that matter. The headline figure is total spend divided by resolved tasks, and it should appear next to the median and the 95th percentile of cost per task. Show attempts per task and the share of capped runs as supporting ratios beside the headline. Refresh the report daily, and keep a 30-day window so that short-lived spikes remain visible to the team. Add human escalation cost from your support system so the report reflects the full cost of each resolved ticket. A report that shows only the average hides the expensive tail where budgets are actually lost.
-- cost per resolved task by task type, last 30 days
SELECT
  task_type,
  COUNT(*) AS tasks,
  SUM(CASE WHEN outcome = 'resolved' THEN 1 ELSE 0 END) AS resolved,
  SUM(cost_usd) / NULLIF(SUM(CASE WHEN outcome = 'resolved' THEN 1 ELSE 0 END), 0) AS cost_per_resolved_task,
  PERCENTILE_CONT(0.5) WITHIN GROUP (ORDER BY cost_usd) AS p50_cost,
  PERCENTILE_CONT(0.95) WITHIN GROUP (ORDER BY cost_usd) AS p95_cost,
  AVG(attempts) AS avg_attempts
FROM task_costs
WHERE finished_at >= CURRENT_DATE - INTERVAL '30 days'
GROUP BY task_type;
Step 7 - Enforce budgets and reconcile monthly
Finish by turning the measurement into controls that the agent itself must obey. Wrap the agent loop in a budget guard that checks dollars, steps, and tokens against the contract before every model call and stops cleanly when a limit is reached. Add alerts on the 99th percentile cost per task, attempts per task, and cache hit rate. Then schedule a monthly reconciliation that compares the ledger total to the provider invoice and investigates any gap above a few percent. Review capped runs weekly and feed what you learn back into the task contract from Step 1. The loop of contract, ledger, report, and guard is the working core of the whole program.
# guard.py
class BudgetExceeded(Exception):
    pass

class BudgetGuard:
    def __init__(self, max_dollars, max_steps, max_tokens):
        self.max_dollars = max_dollars
        self.max_steps = max_steps
        self.max_tokens = max_tokens
        self.dollars = 0.0
        self.steps = 0
        self.tokens = 0

    def charge(self, dollars, tokens):
        self.dollars += dollars
        self.steps += 1
        self.tokens += tokens

    def check(self):
        if self.dollars >= self.max_dollars:
            raise BudgetExceeded(f"dollar cap reached: {self.dollars:.2f}")
        if self.steps >= self.max_steps:
            raise BudgetExceeded(f"step cap reached: {self.steps}")
        if self.tokens >= self.max_tokens:
            raise BudgetExceeded(f"token cap reached: {self.tokens}")
Recommended by AIplusInfo
Two books to go deeper on cost and tracing
Hand-picked reading that maps to the instrumentation and evaluation steps described above.
As an Amazon Associate, AIplusInfo earns from qualifying purchases.

Book
AI Engineering: Building Applications with Foundation Models
Chip Huyen's guide covers evaluation, latency, and cost tradeoffs for foundation model applications, the engineering context behind every cost per task figure.
Buy on Amazon
Book
Observability Engineering: Achieving Production Excellence
The O'Reilly reference on tracing and high-cardinality telemetry explains the span-level instrumentation that makes per-task cost attribution possible.
Buy on AmazonKey Insights
- Agentic workflows need five to thirty times more tokens per task than a chatbot, per a Cisco summary of Gartner estimates, so token prices alone cannot forecast budgets.
- Anthropic found that token usage alone explains 80 percent of performance variance on the BrowseComp evaluation, which ties the dollars an agent spends directly to how well it performs.
- On HumanEval, LATS with GPT-4 cost $134.50 while a simple warming baseline cost $2.45, and the baseline also scored higher accuracy, which makes the case for cost-controlled evaluation.
- An audit of 30 production engineering teams found that resent context alone accounted for 62 percent of the agent inference bill, making context trimming the highest-leverage optimization.
- Across 21,730 rollouts costing about $40,000, the Holistic Agent Leaderboard found that higher reasoning effort gave equal or lower accuracy in 21 of 36 combinations.
- Anthropic prices cache reads at 0.1 times the base input rate while five-minute cache writes cost 1.25 times, so cache hit rate belongs in every cost per task report.
- Elastic reports 85 percent of enterprise IT organizations plan LLM observability but only 8 percent have implemented it, leaving most teams unable to attribute spend to individual runs.
Taken together, these findings describe one consistent and repeating pattern across the research. Agents consume far more tokens per task than chat, and most of that growth comes from resent context, retries, and reasoning loops rather than the final answer. Because token usage drives both performance and cost, the cheapest design is rarely the one with the lowest per-token price. Evidence from controlled evaluations shows that simple baselines and careful routing often match elaborate architectures at a small fraction of the spend. Yet most organizations still lack the tracing needed to see this in their own systems. Measuring cost per resolved task is therefore the shortest path from anecdote to a budget that holds.
| Metric | Unit of work | Counts retries | Counts failures | Best used for |
|---|---|---|---|---|
| Cost per token | One input or output token | No | No | Comparing list prices between models |
| Cost per request | One API call to a model | No | No | Capacity planning and rate-limit budgeting |
| Cost per attempt | One complete agent run | Counts one try only | No, failures look like successes | Prompt and model tuning |
| Cost per task | Every attempt for one task identifier | Yes | Spend included, outcome not judged | Budgets, caps, and alerting |
| Cost per resolved task | One verified success | Yes | Yes, failed spend is spread across successes | Unit economics and ROI comparisons |
| Cost per outcome (vendor price) | One billable outcome defined by the vendor | Absorbed by the vendor | Vendor definition decides | Buying agent services |
| Fully loaded cost per task | Task plus humans, platform, and cleanup | Yes | Yes, including escalations and leaked errors | Human break-even analysis |
| Quality-adjusted cost per task | Success rate times accuracy, divided by cost | Yes | Yes, weighted by answer quality | Ranking agents where quality varies |
Examples of Agent Cost Per Task Measurement in Practice
Anthropic's Multi-Agent Research System
Among the best documented public cases, Anthropic built a multi-agent research system and published its token accounting alongside the design. The team ran evaluations on BrowseComp and found that agents typically use about four times more tokens than chat, while multi-agent systems use about fifteen times more. Three factors explained 95 percent of the performance variance, and token usage by itself explained 80 percent of it. Tool calls and model choice were the other two factors, which means spend and quality moved together rather than apart. The same write-up cautions that these systems still need tasks valuable enough to pay for the extra performance. That economic limit is the practical lesson for anyone budgeting a multi-agent system. A 15x token multiplier is only acceptable when each finished task earns far more than it costs.
Princeton's HumanEval Cost Audit
Researchers at Princeton ran a cost-controlled comparison of coding agents, executing each agent five times on the 164 HumanEval problems and reporting mean accuracy and mean total cost in dollars. A simple warming baseline on GPT-4 reached 93.2 percent accuracy for $2.45, while LATS on GPT-4 reached 88.0 percent for $134.50 in total spend. An escalation strategy produced 85.0 percent accuracy for only $0.27, which made it the cheapest option on the frontier. The authors concluded that state-of-the-art architectures did not outperform simple baselines, and that cost can differ by almost two orders of magnitude for similar accuracy. The main limitation is age, since the models and prices date from an earlier generation and absolute dollar figures have moved. The method still transfers directly, because any team can rerun five trials per configuration and plot accuracy against cost.
Intercom Fin's Per-Resolution Pricing
Intercom rolled out outcome-based pricing for its Fin support agent, charging $0.99 per outcome on every plan. A resolution counts when Fin answers the question and the customer either confirms it helped or leaves without requesting more help. Billing is capped at one outcome per conversation, and there is no charge when a customer asks for a human or when Fin escalates. As an illustration, a team handling 10,000 conversations at a 60 percent resolution rate would pay $5,940, which is about 59 cents per conversation. That is a clean cost per resolved task from the buyer's side, but it covers only the vendor fee. Help-center upkeep, human escalation, and the risk that a silent abandonment is billed as a success still sit outside the price, so buyers should measure those separately.
Lessons From Teams That Learned Cost Discipline the Hard Way
Case Study: Klarna's AI Assistant and the Quality Correction
Looking at customer service first, Klarna faced a large and growing support load, and it needed to answer chats faster without growing a human team at the same pace. The company launched an AI assistant that, in its first month, handled 2.3 million conversations, which was two-thirds of its customer service chats. Klarna reported that resolution time fell from 11 minutes to under two minutes, repeat inquiries dropped by 25 percent, and it projected a $40 million profit uplift. Those numbers made the assistant a reference point for the whole industry, and many executives copied its cost logic. The headline figures were company statements rather than independent audits, and they measured speed and volume more than customer satisfaction. That gap mattered later, because cost per conversation looked excellent while quality was harder to see.
A year later the chief executive told the press that the push had gone too far. He said that cost had become a too predominant evaluation factor and that this led to lower quality. Klarna began recruiting human agents again and said customers should always be able to reach a person. The controversy offers a clean and practical lesson for every measurement team. A scoreboard dominated by cost per conversation will drift toward cheap answers unless quality, repeat contact, and escalation are measured with equal weight. The company still reports large automation gains, so the correction was a rebalancing rather than a reversal.
Case Study: Replit Agent 3 and the Pricing Backlash
Replit faced a billing problem that many agent vendors share, which is that real work is uneven and per-step pricing is hard to predict. Before June it charged $0.25 per checkpoint and added up multi-checkpoint tasks one by one. It then introduced effort-based pricing that bundled complex tasks into a single, more expensive checkpoint, and it launched Agent 3 on September 10 as its most autonomous release. Users reported sharp increases, including one who said they spent $1,000 in a single week after never exceeding $180 to $200 a month. Another user reported losing $70 in one night, and a single prompt was reported at $20, according to The Register's coverage. Replit acknowledged that effort-based pricing can end up more expensive over the lifetime of a project, and at publication it had not yet answered questions about the changes.
The case shows what happens when cost per task is unpredictable from the customer's side. Tasks on new apps that ran over an hour and 45 minutes were charged only four to six dollars. Edits to existing projects cost two to four dollars per interaction. That spread is exactly the distribution problem described earlier, and averages hide it. Vendors and internal platform teams alike should show a cost estimate before a task starts, offer a hard cap, and display the running total. The limitation of the evidence is that it rests on user reports and a single news article rather than Replit's own billing data.
Case Study: The Holistic Agent Leaderboard's $40,000 Evaluation Bill
Researchers building the Holistic Agent Leaderboard faced a measurement problem, because agent benchmarks often reported accuracy without cost and used inconsistent scaffolds. They built a standardized evaluation harness and ran 21,730 agent rollouts across nine benchmarks and nine models, which cost about $40,000 in compute. The results overturned a common assumption: in 21 of 36 model-agent-benchmark combinations, higher reasoning effort produced equal or lower accuracy. The most expensive model sat on the cost-accuracy Pareto frontier in only one of nine benchmarks, and Gemini 2.0 Flash appeared on the frontier in seven. The authors also analyzed more than 2.5 billion tokens of model calls, finding that agents that verified their answers were 13 to 87 percent more likely to succeed.
The study has several limits that careful readers should respect before copying its conclusions. Its frontier results are specific to the benchmarks, models, and prices of the time, and prices have since changed. The authors also had to exclude one scaffold after log analysis exposed a data leakage flaw, which shows that even careful cost-controlled evaluation can be corrupted. The evaluation itself cost a significant amount, a reminder that measurement is not free and should be budgeted too. Even so, the central message of the study holds up under every cut of the data. Paying more for a model or for more reasoning does not reliably buy better results.
Common Questions About Agent Cost Per Task Measurement
It is the practice of tracing every model call, tool call, and retry behind one agent task and converting that usage to dollars. The total is then divided by the number of tasks that met a defined success test. The result is a cost figure that finance, product, and engineering can all use for budgets and comparisons. It replaces per-token prices, which describe inputs rather than finished work.
Cost per token describes the price of a unit of input or output, while cost per task describes the full spend needed to finish one piece of work. An agent may call a model many times, retry after failures, and resend growing context on every step. Those multipliers never appear anywhere on a vendor price sheet. Cost per task captures them, which is why two agents at identical token prices can differ greatly in total spend.
Price each model call by multiplying its input, output, cache read, and cache write tokens by their separate rates and dividing by one million. Add tool, retrieval, and service charges, then sum every attempt that belongs to the task identifier. Divide total spend by the number of verified successes to get cost per resolved task. When failures escalate to a person, add the failure rate times the human handling cost.
A task is whatever unit of work your task contract defines, with a trigger, a boundary, an owner, and a success test. A support ticket or a pull request is a typical example. Success should be judged by a check you trust, such as a confirmed fix, a passing test suite, or a sampled human review. Containment, meaning the bot simply stopped talking, should not count as success.
Agents loop through planning, tool use, and observation, and each step resends the accumulated context to the model. Anthropic reported that agents use about four times more tokens than chat and multi-agent systems about fifteen times more. Gartner estimates are often quoted at five to thirty times more tokens per task than a chatbot. Retries and reasoning steps add further multipliers on top of that base.
Cached tokens are priced at different multipliers than normal input, so they need their own terms in the formula. Anthropic documents cache reads at 0.1 times the base input price, five-minute cache writes at 1.25 times, and one-hour writes at 2 times. Charging every input token at the headline rate overstates cost on cache-heavy agents. Tracking the cache hit rate per agent also reveals prompt changes that silently remove the discount.
Any tracing system that supports OpenTelemetry can carry token usage and your own cost attributes on spans. Observability vendors, open-source collectors, and a plain JSON lines file all work if the task identifier is consistent. The tool matters less than the discipline of pricing each call at log time from a versioned price table. Reconciling the ledger against provider invoices every month confirms that the pipeline is accurate.
A team with automatic instrumentation, a strict price lookup, and a reconciliation job can usually trust its numbers within a sprint or two. The slow part is agreeing on the task definition and success test, not writing code. Expect another month of data before percentiles and ratios stabilize. Review the first reconciliation closely, because any gap larger than a few percent signals a missing cost source.
No, because a cheaper model that fails more often needs more attempts or more human cleanup. Expected cost per solved task equals attempt cost divided by success probability, so a low-priced model with a low success rate can lose. Test candidates on your own tasks and compare cost per resolved task, not list prices. Routing easy tasks to a small model and escalating hard ones often wins.
Set the cap from your own data rather than a published figure. A common starting point is a multiple of the 95th percentile cost of successful tasks, so legitimate hard cases still finish. Enforce the cap on dollars, steps, and tokens together, not on any one of them. Review every capped run, because clusters of them usually point to one broken tool or one ambiguous instruction.
Yes, it can hurt quality if cost becomes the only scoreboard for the team. Klarna's chief executive said cost had become a too predominant evaluation factor that led to lower quality. Pair cost with quality measures such as repeat contact, reopened tickets, and customer satisfaction. Sample cheap runs for human review so savings never come from quietly worse answers.
Unlikely, because unit prices keep falling while the tokens used per task keep rising. Cisco notes that standard model prices have dropped by more than 99 percent, yet reasoning models are expected to push overall inference costs up. Small per-call savings are quickly overwhelmed by steadily growing call counts. Measurement becomes more important as agents take on longer and more autonomous work.
Convert the vendor price into the same cost per resolved task unit you use internally. Read how the vendor defines a billable outcome, what happens when a conversation reopens, and whether a monthly cap exists. Then add your own costs for escalation, help-center upkeep, and ongoing monitoring of the agent. Compare the fully loaded figures every quarter, since vendor terms and your volumes both change.