
What is Data Science?
Lets look at the top data science interview questions and answers, hope this helps your preparation. Data science is the process of extracting information from data using certain principles and techniques, and then utilizing it in the real world. It can be considered as a combination of statistics, machine learning, artificial intelligence etc.
Also Read: What is a Derivative? Understanding the Cornerstone of Calculus
Table of contents
- What is Data Science?
- What is The Difference Between Data Analytics & Data Science
- How is Data Science different from traditional application programming?
- Basic and Advanced Data Science Interview Questions
- What are the differences between supervised and unsupervised learning?
- How is Logistic Regression Done?
- Explain the steps in making a decision tree.
- How do you build a random forest model?
- How can you avoid overfitting your model?
- Differentiate between univariate, bivariate, and multivariate analysis.
- What are the feature selection methods used to select the right variables?
- What are dimensionality reduction and its benefits?
- How should you maintain a deployed model?
- What are recommender systems?
- How can you select k for k-means?
- What is the significance of p-value?
- How can outlier values be treated?
- How can time-series data be declared as stationery?
- What is the ROC curve?
- What is a Confusion Matrix?
- What is pruning in a decision tree algorithm?
- What is entropy in a decision tree algorithm?
- What is a normal distribution?
- What is Deep Learning?
- What is an RNN (recurrent neural network)?
- Basic Data Science Interview Questions
- What are the feature vectors?
- What is root cause analysis?
- Do gradient descent methods always converge to similar points?
- What are the drawbacks of the linear model?
- What are the confounding variables?
- What is star schema?
- How regularly must an algorithm be updated?
- What is selection bias?
- What is survivorship bias?
- What is a bias-variance trade-off?
- How do you work towards a random forest?
- Why is R used in Data Visualization?
- What is the difference between a box plot and a histogram?
- Difference between an error and a residual error
- What does NLP stand for?
- Conclusion
- References
What is The Difference Between Data Analytics & Data Science
Data Analytics |
Data Science |
| Data analytics involves using/analyzing data to provide insightful conclusions and find solutions to issues. | Data Science involves specialized programming, and combines it with math and statistical knowledge to examine which questions need answering and where to find the related data. |
| Data analytics requires skills like data mining, data modeling, database management and data analysis. | Machine Learning, Hadoop, Java, Python, software development etc., are the tools of Data Science. |
| Use the existing information to uncover the actionable data. | Data Science helps uncovering new questioning methods, ways of analysis and new patterns |
| Utilizing specialized hardware and software, verify the data from the provided information. | Utilizing algorithms/scientific methods to extract knowledge from unstructured data. |
Also Read: How do you enable better programming culture in teams?
How is Data Science different from traditional application programming?
Data scientists write code as a means to an end, whereas software developers write code to build things. Data science is inherently different from software development in that data science is an analytic activity, whereas software development has much more in common with traditional engineering.
Also Read: OpenAI’s Model Exhibits Self-Preservation Tactics
Basic and Advanced Data Science Interview Questions
What are the differences between supervised and unsupervised learning?
|
Supervised Learning |
Unsupervised Learning |
|---|---|
|
|
How is Logistic Regression Done?
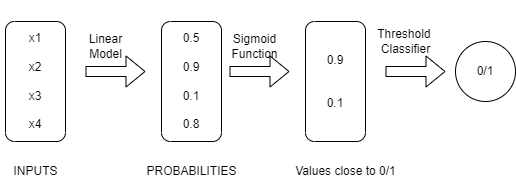
Logistic regression is a technique that measures the correlation between two variables. It uses the underlying logistic function to estimate the likelihood of the dependent variable (our label of what we want to predict) and one or more independent variables (our features) (sigmoid).
The image shown below depicts how logistic regression works:
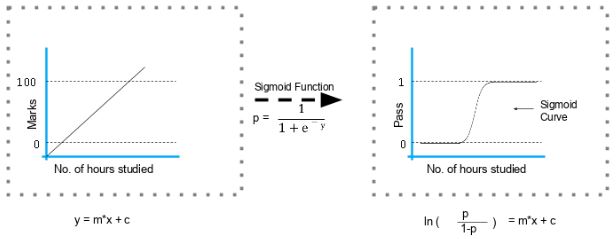
The formula and graph for the sigmoid function are as shown:
Explain the steps in making a decision tree.
- Take the entire data set as input
- Calculate entropy of the target variable, as well as the predictor attributes
- Calculate your information gain of all attributes (we gain information on sorting different objects from each other)
- Choose the attribute with the highest information gain as the root node
- Repeat the same procedure on every branch until the decision node of each branch is finalized
Example: The decision tree for accepting or declining a job offer would be as shown:
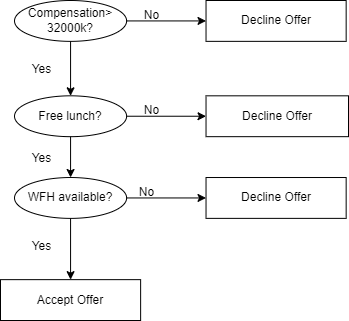
It is clear from the decision tree that an offer is accepted if:
- Salary is greater than $50,000
- The commute is less than an hour
- Incentives are offered
How do you build a random forest model?
A random forest can be said to be a collection of a number of decision trees. If the data is segregated into packages and decision trees are created for each of them. The random forest combines all these trees.
Steps for creating a random forest model:
- From the total set of features choose a very small set of k feaures.
- Among the ‘k’ features, calculate the node D using the best split point
- Split the node into daughter nodes using the best split
- Repeat steps two and three until leaf nodes are finalized
- Build forest by repeating steps one to four for ‘n’ times to create ‘n’ number of trees
How can you avoid overfitting your model?
If the parameters of a model are set for only for a very small amount of data ,ignoring the overall general pattern, model is said to be overfitted. Overfitting is when a model completely fits the training data and struggles or fails to generalize the testing data. This happens when the model memorizes noise in the training data and fails to pick up essential patterns which can help them with the test data.There are three main methods to avoid overfitting:
- Keep the model simple—take fewer variables into account, thereby removing some of the noise in the training data
- Use cross-validation techniques, such as k folds cross-validation
- Using regularization techniques which can penalize certain model parameters if they’re likely to cause overfitting.
Differentiate between univariate, bivariate, and multivariate analysis.
Univariate
Univariate as the name suggests, means containing only one variable.The univariate analysis’s goals are to explain the data and identify any patterns in it.
Example: height of students
|
Height (in cm) |
|
164 |
|
167.3 |
|
170 |
|
174.2 |
|
178 |
|
180 |
There are different indicators like dispersion or range, minimum, maximum, measures of central tendency such as mean, median, mode etc that can be used to study patterns and draw conclusions
Bivariate
Bivariate data involves two different variables. This type of data analysis investigates relationships and causes in order to comprehend the causal relationship between the two variables.
Example: temperature and ice cream sales in the summer season
|
Temperature (in Celcius) |
Sales |
| 20 | 2,000 |
| 25 | 2,100 |
| 26 | 2,300 |
| 28 | 2,400 |
| 30 | 2,600 |
| 36 | 3,100 |
Here, the relation is observed between the independent and dependent variable and predictions for new data are made based on extrapolating the relation.
Multivariate
Mutlivariate analysis is used to classify the cases where 3 or more variables are involved. It contains more than one dependent variable and is similar to bivariate.
Example: data for house price prediction
|
No. of rooms |
Floors |
Area (sq ft) |
Price |
| 2 | 0 | 900 | $4000,00 |
| 3 | 2 | 1,100 | $600,000 |
| 3.5 | 5 | 1,500 | $900,000 |
| 4 | 3 | 2,100 | $1,200,000 |
Here, similar to bivariate, the nature of change in dependent variable is observed against changes in the independent variables and predictions for new data are made based on extrapolating the relation.
What are the feature selection methods used to select the right variables?
Filter and wrapper methods are the 2 main methods for feature selection.
Filter Methods
This involves:
- Linear discrimination analysis
- ANOVA
- Chi-Square
The best analogy for selecting features is “bad data in, bad answer out.” When we’re limiting or selecting the features, it’s all about cleaning up the data coming in.
Wrapper Methods
This involves:
- Forward Selection: We test one feature at a time and keep adding them until we get a good fit
- Backward Selection: We test all the features and start removing them to see what works better
- Recursive Feature Elimination: Recursively looks through all the different features and how they pair together
Wrapper methods require a lot of manual labor, extensive data analysis tasks often requiring powerful computers.
What are dimensionality reduction and its benefits?
The process of converting a data set with vast dimensions into a fewer dimensions dataset to convey similar information concisely.
Benefits of Dimensionality reduction:-
- Compress data thus reducing storage space.
- Reduces computation time
- Removes redundant features; for example, there’s no point in storing a value in two different units (kilograms and tonnes).
How should you maintain a deployed model?
Below are the steps:
Monitor
To assess the performance accuracy of all models, ongoing monitoring is necessary. Knowing how your modifications will impact things is important while making adjustments. This has to be watched to make sure it’s carrying out its intended function.
Evaluate
Evaluation metrics of the current model are calculated and based on this decision to switch to a different algorithm is made
Compare
Comparison between different models to determine the most suitable one.
Rebuild
Rebuilding the current state of data helps with improvement.
What are recommender systems?
A recommender system predicts what a user would rate a specific product based on their preferences. It can be split into two different areas:
Collaborative Filtering
Example: recommending tracks that other users with similar interests play often. This is also commonly seen on Amazon after making a purchase; customers may notice the following message accompanied by product recommendations: “Users who bought this also bought…”
Content-based Filtering
Example: Uses properties of a song to recommend it to listeners who listen to songs with these properties.
How can you select k for k-means?
We use the elbow method to select k for k-means clustering. The idea of the elbow method is to run k-means clustering on the data set where ‘k’ is the number of clusters.
Within the sum of squares (WSS), it is defined as the sum of the squared distance between each member of the cluster and its centroid.
What is the significance of p-value?
p-value < 0.05 The above value range suggests rejecting the null hypothesis.
p-value > 0.05 The above value range suggests accepting the null hypothesis
p-value ~= 0.05 This suggests that the p value can be either in support of or against the null hypothesis.
How can outlier values be treated?
You can drop outliers only if it is a garbage value.
Example: height of an adult = abc ft. This cannot be true, as the height cannot be a string value. In this case, outliers can be removed.
If the outliers have extreme values, they can be removed. Ex: If the points are custered between 10 and 20 and some point is present at 200 we can ignore it. (remove it)
If you cannot drop outliers, you can try the following:
- Try a different model. Non linear models can be used to fit the outliners detected by linear models. Therefore, be sure you are choosing the correct model.
- Try normalizing the data. This way, the extreme data points are pulled to a similar range.
- You can use algorithms that are less affected by outliers; an example would be random forests.
How can time-series data be declared as stationery?
When the mean and variance of a series are constant it is said to be a stationery time series.
Here is a visual example:
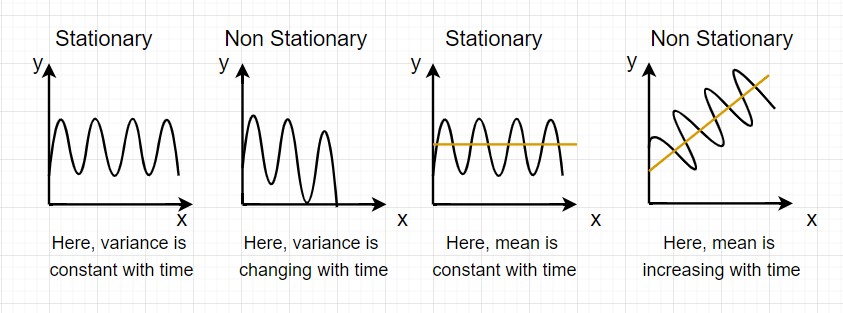
In the first graph, the variance is constant with time. Here, X is the time factor and Y is the variable. Given that Y is continuously moving between the same points it is stationary.
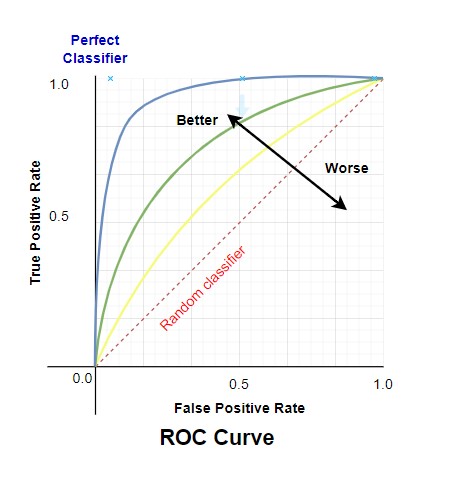
What is the ROC curve?
A receiver operating characteristic curve, or ROC curve, is a graphical plot that illustrates the diagnostic ability of a binary classifier system as its discrimination threshold is varied.
The ratio of False Positives to all Negative Samples is used to calculate the False Positive Rate (FPR), and the ratio of True Positives to all Positive Samples is used to calculate the True Positive Rate (TPR).
The TPR and FPR values are plotted on various threshold values in order to construct the ROC curve. The ROC curve’s area under the curve has a range from 0 to 1. A completely random model, which is represented by a straight line, has a 0.5 ROC. The amount of deviation a ROC has from this straight line denotes the efficiency of the model
What is a Confusion Matrix?
A confusion matrix is used for qualifying how well a classification algorithm does.
If your dataset has more than two classes or if each class has an uneven amount of observations, classification accuracy alone may be deceiving.
You may acquire a better understanding of the categorization model’s successes and failures by calculating a confusion matrix.
Below is the process for calculating a confusion Matrix.
- You need a test dataset or a validation dataset with expected outcome values.
- Make a prediction for each row in your test dataset.
- From the expected outcomes and predictions count:
- The number of correct predictions for each class.
- The number of incorrect predictions for each class, organized by the class that was predicted.
These numbers are then organized into a table, or a matrix as follows:
- Expected down the side: Each row of the matrix corresponds to a predicted class.
- Predicted across the top: Each column of the matrix corresponds to an actual class.
The counts of correct and incorrect classification are then filled into the table.
The total number of correct predictions for a class go into the expected row for that class value and the predicted column for that class value.
In the same way, the total number of incorrect predictions for a class go into the expected row for that class value and the predicted column for that class value.
What is pruning in a decision tree algorithm?
Pruning is a technique that removes the parts of the Decision Tree which prevent it from growing to its full depth. The parts that it removes from the tree are the parts that do not provide the power to classify instances. A Decision tree that is trained to its full depth will highly likely lead to overfitting the training data – therefore Pruning is important.
What is entropy in a decision tree algorithm?
Information Entropy or Shannon’s entropy quantifies the amount of uncertainty (or surprise) involved in the value of a random variable or the outcome of a random process. Its significance in the decision tree is that it allows us to estimate the impurity or heterogeneity of the target variable.
Subsequently, to achieve the maximum level of homogeneity in the response variable, the child nodes are created in such a way that the total entropy of these child nodes must be less than the entropy of the parent node.
What is a normal distribution?
The normal distribution is a very important continuous probability distribution in statistics for independent, random variables because it accurately describes the distribution of values for many natural phenomena.Its also known as the Gaussian distribution, and fairly recognized by its familiar bell-shaped curve in statistical reports.
In a normal distribution, the majority of the observations are centered around the middle peak of the normal distribution, which is the mean. The probabilities for values that are farther from the mean taper of equally in both directions. Extreme values in the distribution’s two tails are likewise rare.
What is Deep Learning?
Deep learning is a subset of machine learning, which is essentially a neural network with three or more layers. These neural networks attempt to simulate the behavior of the human brain—albeit far from matching its ability—allowing it to “learn” from large amounts of data
What is an RNN (recurrent neural network)?
RNNs are a powerful and robust type of neural network, and belong to the most promising algorithms in use because it is the only one with an internal memory.
They are feed-forward neural networks that focus on modeling in the temporal domain. The distinctive feature of RNNs is their ability to send information over time steps. In their structure, RNNs have an additional parameter matrix for connections between time steps that promotes training in the temporal domain and exploitation of the sequential nature of the input. RNNs are trained to generate output where the predictions at each time step are based on current input and information from the previous time steps. RNNs are applicable to analysis of input in the time series domain. Data in this domain are ordered and context-sensitive, while elements in one time step are related to elements in the previous time steps
Basic Data Science Interview Questions
What are the feature vectors?
A feature vector is an ordered list of numerical properties of observed phenomena. It represents input features to a machine learning model that makes a prediction. Humans can analyze qualitative data to make a decision.
What is root cause analysis?
Often we run into some bug or issue that requires extensive investigation to get to the origin of the bug. This involves a step-by-step backtracking of the series of changes that might have been made in a program till a point before which it was functioning as intended. This detailed analysis is known as RCA or root-cause analysis
Do gradient descent methods always converge to similar points?
No, because in case of data having multiple minima/maxima points , gradient descent works only in cases where we start from the point on the curve surrounding the global optima and set the descent step parameters sufficiently small, otherwise they might converge to a local optima point.
What are the drawbacks of the linear model?
- Non-Linearity of the response-predictor relationships.
- Correlation of error terms.
- A non-constant variance of the error term
- Collinearity.
- Outliers and High Leverage Points.
What are the confounding variables?
Confounding variables (a.k.a. confounders or confounding factors) are a type of extraneous variable that are related to a study’s independent and dependent variables. A variable must meet two conditions to be a confounder:
- It must be correlated with the independent variable. This may be a causal relationship, but it does not have to be.
- It must be causally related to the dependent variable
Example of a confounding variable-You collect data on sunburns and ice cream consumption. You find that higher ice cream consumption is associated with a higher probability of sunburn. Does that mean ice cream consumption causes sunburn.Here, the confounding variable is temperature: hot temperatures cause people to both eat more ice cream and spend more time outdoors under the sun, resulting in more sunburns.
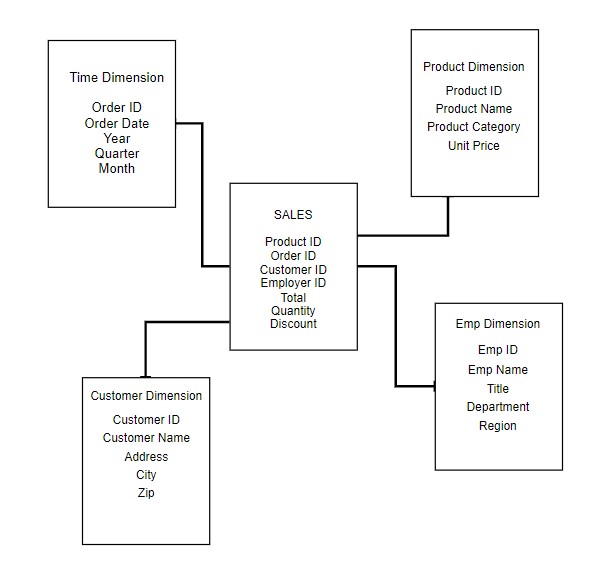
What is star schema?
It is a traditional database schema with a central table.
It is the fundamental schema among the data mart schema and it is simplest. This schema is widely used to develop or build a data warehouse and dimensional data marts. It includes one or more fact tables indexing any number of dimensional tables. The star schema is a necessary cause of the snowflake schema. It is also efficient for handling basic queries.
It is said to be star as its physical model resembles to the star shape having a fact table at its center and the dimension tables at its peripheral representing the star’s points. Below is an example to demonstrate the Star Schema:
How regularly must an algorithm be updated?
You will want to update an algorithm when:
- You want the model to evolve as data streams through infrastructure
- The underlying data source is changing
- There is a case of non-stationarity
What is selection bias?
Selection bias refers to situations where research bias introduced due to factors related to the study’s participants. Selection bias can be introduced via the methods used to select the population of interest, the sampling methods, or the recruitment of participants.
What is survivorship bias?
Survivorship bias is a form of selection bias. It occurs when a dataset only considers existing (or “surviving”) observations and fails to consider observations that have ceased to exist.
For example, when investigating the profitability of the tech industry, one has to also study businesses that went bankrupt, rather than only focusing on businesses currently in the market.
Focusing on a subset of your sample that has already passed some sort of selection process increases your chances of drawing incorrect conclusions.
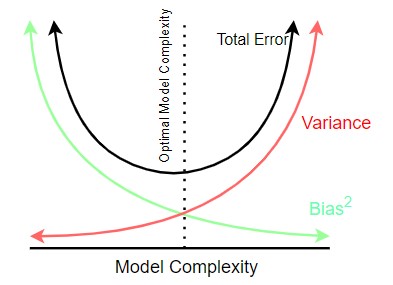
What is a bias-variance trade-off?
Bias–variance tradeoff is the property of a model that the variance of the parameter estimated across samples can be reduced by increasing the bias in the estimated parameters.
Bias is the difference between your model’s expected predictions and the true values.
Variance refers to your algorithm’s sensitivity to specific sets of training data.
Low variance (high bias) algorithms tend to be less complex, with simple or rigid underlying structure.
- They train models that are consistent, but inaccurate on average.
- These include linear or parametric algorithms such as regression and naive Bayes.
On the other hand, low bias (high variance) algorithms tend to be more complex, with flexible underlying structure.
- They train models that are accurate on average, but inconsistent.
- These include non-linear or non-parametric algorithms such as decision trees and nearest neighbors.
This tradeoff in complexity is why there’s a tradeoff in bias and variance – an algorithm cannot simultaneously be more complex and less complex.
How do you work towards a random forest?
The underlying principle of this technique is that several weak learners combine to provide a strong learner. The steps involved are:
- Build several decision trees on bootstrapped training samples of data
- On each tree, each time a split is considered, a random sample of mm predictors is chosen as split candidates out of all pp predictors
- Rule of thumb: At each split m=p√m=p
- Predictions: At the majority rule
Why is R used in Data Visualization?
In R, we can create visually appealing data visualizations by writing few lines of code. For this purpose, we use the diverse functionalities of R.R comes with built-in support for many standard graphs and provides advanced tools like ggplot2 that improve the quality and aesthetics of your graphs.
What is the difference between a box plot and a histogram?
A histogram is a type of bar chart that graphically displays the frequencies of a data set. Similar to a bar chart, a histogram plots the frequency, or raw count, on the Y-axis (vertical) and the variable being measured on the X-axis (horizontal).
A box plot, also called a box-and-whisker plot, is a chart that graphically represents the five most important descriptive values for a data set. These values include the minimum value, the first quartile, the median, the third quartile, and the maximum value. When graphing this five-number summary, only the horizontal axis displays values. Within the quadrant, a vertical line is placed above each of the summary numbers. A box is drawn around the middle three lines (first quartile, median, and third quartile) and two lines are drawn from the box’s edges to the two endpoints (minimum and maximum).
Difference between an error and a residual error
Error pertain to the true data generating process (DGP), whereas residuals are what is left over after having estimated your model. In truth, assumptions like normality, homoscedasticity, and independence apply to the errors of the DGP, not your model’s residuals. (For example, having fit