
Introduction
AI Bias Audits: How to Test Models for Fairness is now a working question for any team that lets software rank, score, or approve people. The stakes are measurable, and one health-care algorithm shows how large the gap can be. In a landmark Science study of that algorithm, only 17.7 percent of high-risk Black patients were automatically flagged for extra help. Removing the bias would have raised that share to 46.5 percent, which means the model quietly withheld care from roughly two of every three patients who qualified. An audit is the disciplined way to find gaps like that before regulators, plaintiffs, or patients find them first. This guide walks through where bias enters a pipeline, which fairness metrics to choose, and how to run disaggregated tests with open-source code. It also covers language models, mitigation, legal duties under rules such as New York City’s Local Law 144, and the limits of every metric.
Quick Answers on AI Bias Audits and Fairness Testing
What is an AI bias audit and why run one?
AI bias audits: how to test models for fairness begins with measuring whether a model’s errors and decisions differ across demographic groups, then documenting the gaps before deployment.
How do you test a model for fairness?
To test models for fairness in an AI bias audit, split evaluation data by protected group, compute selection rate and error rates for each, then compare gaps against thresholds set in advance.
Which fairness metric should an audit use?
An AI bias audit should pick the fairness metric that matches the harm: selection rate ratios for hiring, equalized odds when errors hurt differently, and calibration when humans read scores.
Key Takeaways
- An AI bias audit compares model behavior across groups using pre-registered metrics, disaggregated data, and confidence intervals, not a single accuracy number.
- No model can satisfy every fairness definition at once, so the audit must record which metric was chosen, why, and what tradeoff it accepts.
- Open-source tools such as Fairlearn make the core measurements a few lines of code, but scoping, group definitions, and documentation decide whether the result is credible.
- Laws in New York City, Colorado, and the European Union increasingly require audits, so evidence quality now matters as much as the findings themselves.
Table of contents
- Introduction
- Quick Answers on AI Bias Audits and Fairness Testing
- Key Takeaways
- What Is an AI Bias Audit?
- Where Bias Enters a Machine Learning Pipeline
- Choosing Fairness Metrics That Fit Your Decision
- The Four-Fifths Rule and Impact Ratios Applied
- Scoping an Audit Before You Touch the Data
- Building a Test Set and Defining Protected Groups
- Disaggregated Evaluation and Error Analysis
- Auditing Language Models and Generative Systems
- Open-Source Toolkits for Fairness Testing
- Mitigation Options After You Find a Gap
- Regulations That Now Require Bias Audits
- Risks and Limits of Fairness Audits
- Ethics of Collecting and Using Sensitive Attributes
- Putting an Audit Program Into Production
- The Future of Fairness Testing
- How to Run an AI Bias Audit on a Classifier, Step by Step
- Key Insights on AI Bias Audits
- AI Fairness Testing in Practice: Three Real Examples
- Lessons From Three High-Profile Bias Cases
- Common Questions About AI Bias Audits and Fairness Testing
What Is an AI Bias Audit?
AI bias audits: how to test models for fairness is the structured practice of measuring whether an automated system treats demographic groups differently, documenting the gaps against defined metrics, and deciding whether those gaps are acceptable, fixable, or disqualifying.
An Interactive From AIplusInfo
Impact Ratio Explorer: Does This Screening Tool Pass the Four-Fifths Test?
Set each group’s selection rate and size, choose a policy threshold, and watch the ratio, the gap, and the statistical uncertainty update.
50%
35%
200
0.80 ratio
Impact ratio
0.70
Below threshold
Selection gap
15 pts
Absolute difference between the two rates
Group B 95% interval
28-42%
Wilson interval for the observed rate
Extra selections to pass
0
Group B selections needed to reach the threshold
Benchmark: federal guidelines at 29 CFR 1607.4 treat a group selection rate below four-fifths of the highest group’s rate as evidence of adverse impact. The rule is a screening heuristic, so pair it with error rate comparisons and confidence intervals.
Where Bias Enters a Machine Learning Pipeline
Bias rarely arrives as a single bad decision; it accumulates across the pipeline, and an audit has to look at every stage. The National Institute of Standards and Technology groups the sources into computational and statistical bias, human bias, and systemic bias, and warns that organizations often default to overly technical fixes. You can read that guidance in the NIST report on bias beyond biased data. Computational bias covers skewed samples and missing groups, while human bias covers the judgments people embed when they label data or choose which outcome to predict. Systemic bias lives in the institutions that produced the historical records the model learns from.
The first technical entry point is the training data itself, which may under-represent some groups or encode past discrimination as if it were ground truth. A hiring model trained on ten years of promotion decisions learns who got promoted, not who would have performed well. Sampling gaps matter too, because a face dataset dominated by lighter-skinned men produces a classifier that works best for lighter-skinned men. The label is the second entry point, since many projects predict a convenient proxy such as cost, arrests, or clicks instead of the outcome they actually care about. The health-care algorithm above used spending as a stand-in for medical need. Black patients incurred lower costs at the same level of illness, so the proxy carried the disparity straight into the score.
Feature engineering and deployment add the remaining entry points to the pipeline. Variables such as zip code, school name, or purchase history can act as proxies for race, gender, or age even when those attributes are removed from the table. Threshold choices turn a continuous score into a yes or no decision, and a single cutoff can produce very different error rates for groups with different score distributions. Deployment creates feedback loops when the model's decisions shape the data it sees next, as when predictive policing sends officers to the same neighborhoods again. Teams that want the wider picture of harms can start with the broader dangers of AI bias, then return here to measure them.
Choosing Fairness Metrics That Fit Your Decision
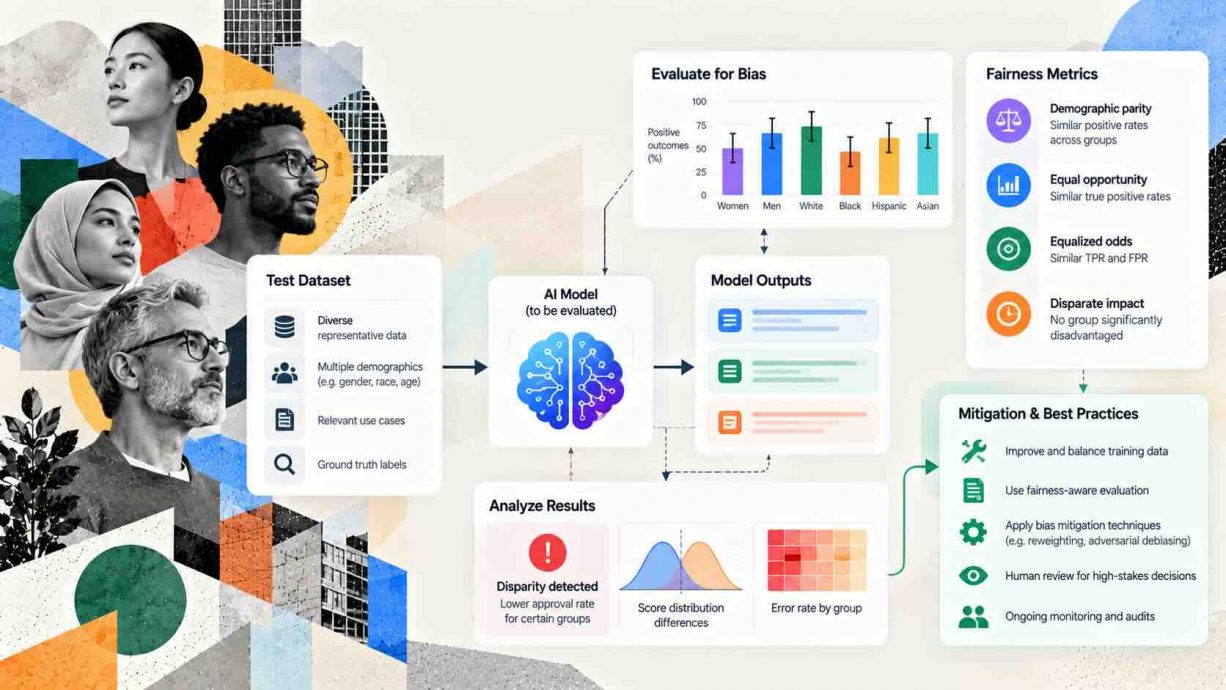
Metric choice is the most consequential decision in an audit, because each definition encodes a different idea of what fair treatment means. Demographic parity asks whether the model selects people from each group at the same rate, which suits allocation decisions such as interviews or loan approvals. Equal opportunity asks whether qualified people in each group are approved at the same rate, so it compares true positive rates across groups. Equalized odds is stricter, because it requires both the true positive rate and the false positive rate to match across groups. Calibration asks whether a score of 70 means the same probability of the outcome for every group, which matters when humans read the score as a risk estimate.
These definitions cannot all hold at once, and that is a mathematical fact rather than an engineering failure. Kleinberg, Mullainathan, and Raghavan showed that, except in highly constrained special cases, no method can satisfy three natural fairness conditions simultaneously. Their result, available in the paper on inherent trade-offs in fair risk scores, explains why a team can fix one disparity and watch another appear. The COMPAS debate is the classic illustration: the developer argued the score was calibrated across races, while journalists showed that false positive rates differed sharply. Both claims were true, and both could not be repaired together because the groups had different base rates of recorded rearrest.
The practical response is to choose a primary metric before looking at results and to write down the reason. Ask what the harm is and who bears it, because a wrongful denial and a wrongful approval rarely cost the same. For a hiring screen, the harm is usually exclusion, so selection rate ratios and true positive rates carry the most weight. For a fraud flag or a risk score that triggers scrutiny, false positive rates matter most because the flagged person pays the price. Report the secondary metrics anyway and state plainly which ones the system fails. A reviewer will trust an audit that admits tradeoffs more than one claiming to satisfy everything.
Fairlearn's documentation makes a point worth repeating about this step. Its guide on common fairness metrics cautions that fairness is a sociotechnical question, so no single number can settle it. Treat each metric as a lens that reveals one kind of gap rather than a verdict on the whole system. Pair the quantitative results with a written description of the decision context, the affected people, and the alternatives they would face without the model. That context is what lets a non-technical reviewer judge whether a measured gap is tolerable. It also keeps the audit from collapsing into a checkbox exercise in which a green metric stands in for judgment.
The Four-Fifths Rule and Impact Ratios Applied
Looking at hiring and promotion decisions, the oldest quantitative fairness test is the four-fifths rule from United States employment law. The rule compares each group's selection rate with the highest group's rate and flags ratios below 0.80. Under 29 CFR 1607.4, a group's selection rate below four-fifths, or 80 percent, of the highest group's rate is generally treated as evidence of adverse impact. The calculation is simple division, and it works for any group you can count. If 50 of 100 men advance but only 30 of 100 women advance, the impact ratio is 0.30 divided by 0.50, which equals 0.60, well below the 0.80 line. The same arithmetic works for race, age bands, or any other group where you can count applicants and selections.
Impact ratios have become the standard output of audits for automated employment tools. New York City's consumer protection department requires that a covered tool be audited within one year before use. A summary of the results must be posted publicly, as described on the city's automated employment decision tools page. The local rule has drawn criticism for loose enforcement among covered employers. For an engineer, the useful takeaway is that regulators expect a ratio per category, a count of people in each category, and a note about categories too small to analyze.
The rule has real limits, and a careful audit says so. It is a screening heuristic for selection rates, so it says nothing about whether the people selected were qualified or whether error rates differ. Fairlearn's guidance notes that the rule originates in a specific legal setting and has no inherent validity outside that context. Small groups produce unstable ratios, because moving one selection in a group of ten changes the ratio by ten points. Add a significance test or a confidence interval, report both, and treat a ratio just above 0.80 as a prompt for investigation rather than a clean bill of health.
Scoping an Audit Before You Touch the Data
Moving on from theory, the first deliverable is a scoping document, and it should exist before anyone opens a dataset. Name the system, the decision it influences, the people affected, the version under test, and the date range of the data. Define what a favorable outcome means, such as being advanced to interview, approved for credit, or receiving a care referral. Record who will act on the findings and what authority they have to pause or change the system. An audit without a decision owner is a report that nobody is obliged to read.
The second part of scoping is pre-registration of the analysis. Write down the protected attributes you will examine, the primary and secondary metrics, the thresholds that count as a finding, and the statistical method for uncertainty. Committing to these choices in advance prevents the quiet temptation to try twenty metrics and report the one that looks best. It also gives an external reviewer a fixed standard to check the work against. Link the plan to your risk process, such as the Govern, Map, Measure, and Manage functions of the NIST AI Risk Management Framework. That gives the audit a clear home inside your existing governance process.
Building a Test Set and Defining Protected Groups
Building on that scope, the audit lives or dies on its evaluation data. The test set must mirror the people the model will actually decide about. The test set must come from the population the model will actually serve. Its labels need ground truth that is independent of the model, and every group needs enough records for stable estimates. A common failure is to reuse the validation split from training, which may under-sample the very groups at risk. Another is to draw ground truth from past decisions made by the biased process you are trying to measure. When a clean outcome label does not exist, say so in the report and list which metrics remain valid. Selection rate comparisons need no ground truth, while error rate comparisons do.
Defining the groups to compare is harder than it first appears. Race, gender, and age are social categories with fuzzy boundaries, and the labels you have may be self-reported, inferred, or missing for large shares of records. Where self-reported attributes exist and law permits their use for testing, prefer them over inferred ones. Where they do not, researchers sometimes use surname and geography to estimate probabilities, but that method adds its own error and should be disclosed along with its uncertainty. Always include intersectional slices such as older women or younger Black men, because the largest gaps often hide at the intersection of two attributes that each look acceptable alone.
Sample size also deserves explicit treatment in the written report. A group of 40 people cannot support a precise error rate, and a table of point estimates without intervals invites false conclusions in both directions. Compute bootstrap or exact binomial confidence intervals, and mark any slice below a minimum count as inconclusive rather than dropping it silently. If the data is thin, consider collecting more, running a synthetic or paired test, or widening the group definition and saying so. The goal is an honest map of what you can and cannot claim. That map helps a decision maker more than a confident chart built on a handful of records.
Disaggregated Evaluation and Error Analysis
Beyond the headline number, the core technical step is disaggregated evaluation: compute every metric separately for each group and compare. Overall accuracy hides disparities because the largest group dominates the average. In the Gender Shades study, one commercial gender classifier erred 34.7 percent of the time on darker-skinned women versus 0.3 percent on lighter-skinned men, per the project's published results. A single accuracy figure for those systems would have looked strong while masking a failure concentrated in one group. The remedy is a table with one row per group and one column per metric, built from the same evaluation set.
Start with three rates for every group: selection rate, true positive rate, and false positive rate. Selection rate shows who gets the favorable outcome, true positive rate shows who is correctly recognized, and false positive rate shows who is wrongly flagged. ProPublica's analysis of the COMPAS risk tool found false positive rates of 44.9 percent for Black defendants and 23.5 percent for white defendants in its investigation of machine bias. Overall accuracy was similar across groups, yet the burden of error fell very differently. Add precision, calibration curves by group, and score distributions so you can see whether a threshold change would help.
Error analysis then asks why the gaps exist and which people they affect. Slice the data by feature values, source system, time period, and data quality flags to find where the model fails and for whom. Inspect a sample of individual errors by hand, case by case. A pattern such as resumes with career gaps or names with diacritics often explains a disparity that no aggregate statistic would reveal. Check whether the gap persists after controlling for legitimate factors such as qualifications, and document the control variables you used. Where a proxy variable drives the difference, name it, because that finding points directly at the fix.
Finally, quantify uncertainty and translate the numbers into a statement a reviewer can act on. Report each gap with a confidence interval and a flag for whether it crosses the threshold you pre-registered. Rank the findings by severity, using the size of the gap, the number of people affected, and the harm of the error type. A small gap affecting millions of decisions can outweigh a large gap in a rare category. Close each finding with a recommended action and an owner, so the analysis ends in a decision rather than a chart.
Auditing Language Models and Generative Systems
Shifting from classifiers to generative systems changes the audit method but not its logic. A language model has no fixed label set, so you test it by changing one protected attribute in an otherwise identical input and watching what moves. The cleanest design is a paired or counterfactual test, where only a name, pronoun, or demographic cue differs between two prompts. Researchers at the University of Washington used this approach on large language models, ranking more than 550 real resumes against over 500 job listings with 120 varied first names. Their results, reported by the University of Washington newsroom, show white-associated names preferred 85 percent of the time and Black-associated names 9 percent.
The same study showed why intersectional slices matter for language models. Female-associated names were preferred only 11 percent of the time against 52 percent for male-associated names. Black male-associated names were never preferred over white male-associated names, while the pattern for Black female names differed again. A test that looked only at gender or only at race would have missed the compounding effect. Build your prompt sets so that every protected attribute can be crossed with every other, and report each cell with its sample size.
Practical audits of generative systems add several details beyond the paired design. Run each prompt many times, because sampling randomness means one response proves nothing, and report the distribution of outcomes rather than a single example. Test the full deployed stack, including the system prompt, retrieval layer, and any safety filters, since the base model alone may behave differently from the product. Score open-ended outputs with a rubric applied by trained reviewers or a validated classifier, and measure agreement between scorers. Public attention to the topic keeps growing, as with the NAACP suit over alleged racial bias at an AI company.
Open-Source Toolkits for Fairness Testing
Beyond the math, Python offers mature libraries that turn the arithmetic of an audit into a few lines. Fairlearn is the most approachable, centered on a class called MetricFrame that computes any scikit-learn style metric for every subgroup. Per its MetricFrame reference page, the object exposes the overall value, a by-group table, the maximum difference between groups, and the minimum ratio. IBM's AI Fairness 360 is a broader toolkit that bundles dozens of metrics with pre-processing, in-processing, and post-processing algorithms, and it includes worked notebooks in its public examples directory. Choose the library that matches your team's stack, because the quality of the audit depends on the design, not the brand.
Other tools fill specific niches that the larger libraries cover less well. Google's What-If Tool lets analysts probe individual predictions and compare thresholds interactively, which helps when explaining findings to non-engineers. Aequitas, from the University of Chicago, produces group-level bias reports aimed at policy teams reviewing risk assessment tools. For large language models, teams often write custom harnesses that call the model API with templated prompts, then pass the outputs to the same MetricFrame logic used for classifiers. Whatever you pick, pin the library version in the audit record, because metric definitions occasionally change between releases.
Mitigation Options After You Find a Gap
Building on a confirmed finding, the next question is what to do about it, and the answer depends on where the problem originates. If the cause is missing or unrepresentative data, the best fix is usually to collect better data rather than to adjust the model. If the cause is a proxy label, change the target to something closer to the real outcome. Technical mitigation is the last resort, not the first, because it can only redistribute error and cannot remove a flawed premise. Fairlearn's guide to mitigation algorithms warns that driving a metric toward zero does not mean the results are fair.
The toolkit sorts its mitigation methods into three broad families. Preprocessing transforms the data before training, as with CorrelationRemover, which reduces linear correlation between sensitive and non-sensitive features. Reductions wrap a standard estimator and train a sequence of reweighted models to meet a constraint, with ExponentiatedGradient and GridSearch supporting demographic parity, equalized odds, and several rate-parity constraints. Postprocessing adjusts predictions after training, and ThresholdOptimizer picks group-specific thresholds to satisfy a chosen constraint. The postprocessing idea traces to Hardt, Price, and Srebro, whose paper on equality of opportunity shows how to adjust any learned predictor.
Every mitigation carries costs that belong in the audit report. Group-specific thresholds can trigger legal objections in settings where using a protected attribute at decision time is prohibited. Randomized predictions, which some Fairlearn methods produce, mean the same input can yield different outputs on different calls. Constraints usually cost some accuracy overall, so report the tradeoff curve and let the decision owner choose the operating point. After any change, rerun the full audit on fresh data, since a fix tuned on the test set proves nothing.
Regulations That Now Require Bias Audits
Turning to the legal landscape, bias auditing has moved from good practice to obligation in several jurisdictions. New York City's Local Law 144 was the first major rule to mandate independent audits of automated employment decision tools. The city's guidance says a tool must have been audited within one year before use. The summary must be posted, and candidates must receive notice ten business days before the tool is used. Those requirements make the audit a recurring operational task with a public output, not a one-time project. Teams hiring in New York should read the city guidance directly and confirm which of their tools count as covered.
State and national laws extend the idea well beyond hiring and into other consequential decisions. Colorado's AI Act imposes duties on developers and deployers of high-risk systems that make consequential decisions, and we explain the compliance steps in our Colorado AI Act compliance guide. The European Union's AI Act addresses bias at the data layer. Article 10 requires data sets to be examined for possible biases. It also calls for measures to detect, prevent, and mitigate them, as shown on the European Commission's Article 10 page.
Existing anti-discrimination law applies to algorithmic decisions with or without a new statute. Regulators and courts ask for evidence, so a documented audit is the best defense. In the United States, the EEOC treats automated hiring tools like any other selection procedure, and the four-fifths rule remains a reference point for adverse impact. Civil litigation is testing the boundaries, as shown by the age discrimination collective action against a major human-resources software vendor discussed in the case studies below. Lenders, insurers, and health systems face parallel duties under their own sector rules. The common thread is that regulators and courts ask for evidence, which means a documented audit is your best defense.
For teams operating across borders, the practical challenge is reconciling different definitions, thresholds, and documentation formats. A reasonable approach is to build one internal standard strict enough to satisfy the most demanding rule, then map outputs to each regime's format. Keep a register of which systems are in scope for which law, who owns each, and when the next audit is due. Track changes in the rules, because several statutes have shifted dates and scope since passage. Assign someone to review those changes each quarter and update the internal standard when a deadline, threshold, or definition moves.
Risks and Limits of Fairness Audits
Despite the value of audits, they carry risks that a mature program names openly. The first is metric conflict, since improving one fairness measure can worsen another, as the impossibility results show. The second is proxy leakage, where removing a protected attribute does nothing because other features reconstruct it. The third is measurement error in the group labels themselves, which can hide real gaps or invent false ones. Fairlearn's own guidance on fairness in machine learning stresses that these systems are sociotechnical, so a metric on a test set cannot capture the whole picture.
A second family of risks is organizational rather than technical in nature. Audit theater occurs when a company commissions a narrow review, publishes a clean summary, and changes nothing about how the system is used. Independence matters here, because an auditor paid by the vendor under review faces pressure to soften findings. Another risk is false reassurance from a single snapshot, since data drift, retraining, and changes in the applicant pool can erode fairness after the audit date. Lack of explanation compounds the problem, which is why transparency failures like those in the dangers of AI opacity make audits harder to act on.
Legal and reputational exposure complete the picture of what can go wrong. An audit that finds a disparity creates a record, and failing to act on that record can be worse than never having looked. This risk is real but should not discourage testing, because regulators and courts treat known-and-ignored problems far more harshly than problems found and remediated in good faith. Work with counsel on privilege and disclosure strategy before the audit starts. Plan the response to a bad finding before you generate one, including who decides whether to pause the system. Finally, remember that a fair model in an unfair process is still part of an unfair outcome.
Ethics of Collecting and Using Sensitive Attributes
Beyond the technical risks, fairness testing creates a genuine ethical tension. To measure whether a system treats groups differently, you need to know who belongs to which group, yet collecting race, health status, or sexual orientation raises privacy and safety concerns. Many organizations avoid collecting these attributes for fear of misuse, which leaves them unable to detect the very disparities they want to prevent. The ethical default is to collect the minimum needed for testing, store it separately from decision systems, and restrict access tightly. The European framework recognizes this tension, and the AI Act's data governance article links to special provisions for processing sensitive categories for bias detection and correction.
Consent, purpose limitation, and community input complete the ethical picture. People who provide demographic data for testing should be told it will not be used to make decisions about them. Affected communities should have a voice in how groups are defined, because categories chosen for statistical convenience may not match how people understand themselves. Our discussion of how AI ethics relates to law explores where these obligations meet. Finally, resist the temptation to treat a passed audit as moral clearance. A system can meet every metric and still be deployed for purposes that harm the people it scores.
Putting an Audit Program Into Production
Moving on from a one-off audit to a program is where most organizations struggle. Start by inventorying every model that affects people, ranking them by the stakes of the decision and the number of people affected. High-stakes systems in hiring, lending, health, housing, education, and public benefits get the deepest and most frequent audits. Assign each system an owner who is accountable for the audit calendar and the response to findings. A lightweight intake form that asks what the model decides, who is affected, and what data it uses will surface systems that would otherwise escape review.
Integrate the audit into the development lifecycle rather than bolting it on at the end. Run a baseline audit at design review, a pre-release audit on the candidate model, and scheduled re-audits after deployment. Automate the metric computation so it runs in the same continuous integration pipeline as other tests, and fail the build when a pre-registered threshold is crossed. Teams building agentic systems can pair the audit with deterministic guardrails for AI agents that block unacceptable outputs at runtime. Treat a failed fairness check with the same seriousness as a failed security test.
Monitoring after launch closes the loop between testing and real-world outcomes. Track selection rates and error rates by group on live traffic, with alerts when the gap exceeds the tolerance you set in the scoping document. Sample production decisions for human review, and give affected people a channel to contest outcomes and report problems. Evaluation tooling for model quality can be extended for this purpose, and our walkthrough of evaluating Amazon Bedrock agents with Ragas shows one pattern for automated scoring. Keep an audit log that records the model version, data window, code commit, metrics, and decisions taken. That log is the evidence a regulator, a customer, or a court will ask for first.
The Future of Fairness Testing
Looking ahead, fairness testing is heading toward continuous, automated, and standardized practice. Regulators are converging on a shared expectation that high-risk systems be tested before deployment and monitored afterward, with documentation available on request. Standards bodies are translating that expectation into checklists, and the NIST AI Risk Management Framework already gives organizations a common vocabulary of govern, map, measure, and manage. Expect auditors to be certified and accredited in the way financial auditors are today. Within a few years, a signed and dated fairness report will likely be a standard part of procurement for any system that scores people.
The technical frontier is generative and agentic systems, where inputs are open-ended and outputs are text, images, or actions. Auditors will need better benchmarks, richer counterfactual generators, and scoring methods that hold up under sampling randomness. Explainability research will help by making it easier to trace a biased outcome to its cause, a topic covered in our explainable AI primer. Organizations are also experimenting with internal review structures, and the future roles of AI ethics boards will shape who signs off on audit results. Teams that build the habit now will find AI Bias Audits: How to Test Models for Fairness far easier to maintain than those starting under deadline.
Chart From AIplusInfo
Who Pays When an Algorithm Gets It Wrong
Error rates in published audits, percent. Each pair compares the group that fared worse with the group that fared better.
Source: ProPublica COMPAS analysis, Gender Shades project, and University of Washington resume study.
How to Run an AI Bias Audit on a Classifier, Step by Step
Step 1 - Set up the environment
Turning to hands-on work, this walkthrough audits a binary classifier with Fairlearn and scikit-learn on a synthetic dataset you can replace with your own. Create a clean virtual environment so the audit record can pin exact library versions. Install the 4 packages shown below, then confirm the installed versions and save them in your audit folder. Pinning matters because metric defaults and function signatures can change between releases, and a reviewer must be able to reproduce your numbers. If your data contains personal information, run the audit on a secured machine and avoid copying records into notebooks that sync to shared storage.
python3 -m venv audit-env
source audit-env/bin/activate
pip install fairlearn scikit-learn pandas numpy
pip freeze > requirements-audit.txt
Step 2 - Load data and generate predictions
Next, prepare an evaluation set with four ingredients: features, true outcomes, model predictions, and a sensitive attribute column kept apart from the features. The script below builds a synthetic population of 6,000 people where group B receives a lower value on a proxy feature, mimicking a biased upstream signal. It trains a logistic regression and predicts on a held-out split, which stands in for your production model. In a real audit you would load predictions from the deployed system rather than retrain, so you test the model people actually experience. Keep the sensitive attribute out of the model inputs, but keep it in the evaluation table.
import numpy as np
import pandas as pd
from sklearn.linear_model import LogisticRegression
from sklearn.model_selection import train_test_split

rng = np.random.default_rng(7)
n = 6000
group = rng.choice(["A", "B"], size=n, p=[0.7, 0.3])
skill = rng.normal(0, 1, n)
proxy = skill * 0.5 + (group == "B") * -0.8 + rng.normal(0, 1, n)
y = (skill + rng.normal(0, 0.7, n) > 0.2).astype(int)
X = pd.DataFrame({"skill_test": skill + rng.normal(0, 0.5, n), "proxy": proxy})

X_tr, X_te, y_tr, y_te, g_tr, g_te = train_test_split(
    X, y, group, test_size=0.4, random_state=7)
model = LogisticRegression().fit(X_tr, y_tr)
pred = model.predict(X_te)
Step 3 - Compute disaggregated metrics
Building on that table, use MetricFrame to compute selection rate, true positive rate, and false positive rate for every group in one call. The by-group property returns a table with one row per group, and the difference and ratio methods summarize the largest gaps. On the synthetic data above, group A shows a selection rate of 0.408 against 0.347 for group B, and a true positive rate of 0.716 against 0.625. Those are the numbers that go into the audit report, alongside the count of records in each group. Always print the group sizes next to the metrics so a reader can judge how much each estimate can be trusted.
from fairlearn.metrics import (MetricFrame, selection_rate,
                               true_positive_rate, false_positive_rate)

metrics = {"selection_rate": selection_rate,
           "tpr": true_positive_rate,
           "fpr": false_positive_rate}
mf = MetricFrame(metrics=metrics, y_true=y_te, y_pred=pred,
                 sensitive_features=g_te)
print(mf.by_group.round(3))
print("max gap:", mf.difference().round(3).to_dict())
print("min ratio:", mf.ratio().round(3).to_dict())
print(pd.Series(g_te).value_counts().to_dict())
Step 4 - Apply the four-fifths check
With the table in hand, convert selection rates into the impact ratio that regulators recognize. Divide the lowest group's selection rate by the highest group's rate, and compare the result with the 0.80 threshold from the employment guidelines. In the synthetic example the ratio is 0.851, which passes the screen even though the true positive rate gap of nine points deserves attention. This illustrates why a single rule is never enough, since the selection rate ratio and the error rate gaps tell different stories. Record both results in the report and note that Fairlearn cautions against applying the rule outside its legal context.
from fairlearn.metrics import demographic_parity_ratio

rates = mf.by_group["selection_rate"]
impact_ratio = rates.min() / rates.max()
print("impact ratio:", round(impact_ratio, 3),
      "FLAG" if impact_ratio < 0.8 else "ok")
print("fairlearn check:", round(demographic_parity_ratio(
    y_te, pred, sensitive_features=g_te), 3))
Step 5 - Add confidence intervals
From there, quantify how much of each gap could be sampling noise by bootstrapping each group's metric. Resample the group's records with replacement, recompute the metric several hundred times, and take the 2.5th and 97.5th percentiles as an interval. On the example data, group B's true positive rate interval runs from roughly 0.57 to 0.68, which is wide enough to matter for a group of this size. Wide intervals are a finding in themselves because they show that more data is needed before drawing firm conclusions. Report any slice with too few records as inconclusive, and note the minimum group size your plan requires.
def boot_ci(y_true, y_pred, groups, metric, reps=500, seed=1):
    rg = np.random.default_rng(seed)
    out = {}
    for g in np.unique(groups):
        idx = np.where(groups == g)[0]
        vals = []
        for _ in range(reps):
            s = rg.choice(idx, size=len(idx), replace=True)
            vals.append(metric(y_true[s], y_pred[s]))
        out[str(g)] = [round(float(v), 3) for v in np.percentile(vals, [2.5, 97.5])]
    return out

print(boot_ci(y_te, pred, g_te, true_positive_rate))
Step 6 - Test a mitigation and compare
Having measured the gaps, try one postprocessing mitigation and rerun the same metrics on the adjusted predictions. ThresholdOptimizer takes the fitted model, learns group-specific decision rules under an equalized odds constraint, and returns new predictions. On the example data the true positive rate gap shrinks from 0.091 to 0.041, at the cost of a lower overall selection rate. Compare accuracy and each fairness metric before and after, and let the decision owner choose between the versions. Remember that using group membership at decision time may be restricted by law in your domain.
from fairlearn.postprocessing import ThresholdOptimizer

to = ThresholdOptimizer(estimator=model, constraints="equalized_odds",
                        prefit=True, predict_method="predict_proba")
to.fit(X_tr, y_tr, sensitive_features=g_tr)
adj = to.predict(X_te, sensitive_features=g_te, random_state=7)
mf2 = MetricFrame(metrics=metrics, y_true=y_te, y_pred=adj,
                  sensitive_features=g_te)
print(mf2.by_group.round(3))
print(mf2.difference().round(3).to_dict())
Step 7 - Write the audit record
Finally, turn the numbers into a durable record that someone else can verify and act on. Save a JSON report containing the model version, data window, code commit, metrics by group, gaps, confidence intervals, and mitigation results. Attach the scoping document, the pinned requirements file, and a short narrative that states the primary metric, the decision, and the recommended action. Store the package where your governance team keeps other compliance evidence, and schedule the next audit date, no more than 12 months out, before closing the ticket. For models that classify people with algorithms like those in our guide to machine learning algorithms, the same record template works with minor changes.
import json

report = {
    "model": "logreg-v1",
    "metric_gaps": mf.difference().to_dict(),
    "impact_ratio": float(impact_ratio),
    "after_mitigation": mf2.difference().to_dict(),
}
with open("audit_report.json", "w") as f:
    json.dump(report, f, indent=2, default=float)
Recommended by AIplusInfo
Books to go deeper on fairness testing
Hand-picked titles that extend the metrics, tools, and cases covered in this walkthrough.
As an Amazon Associate, AIplusInfo earns from qualifying purchases.

Book
Fairness and Machine Learning: Limitations and Opportunities
The standard textbook on statistical and causal fairness measures, and the clearest treatment of why metrics conflict.
Buy on Amazon
Book
Practical Fairness: Achieving Fair and Secure Data Models
A hands-on O'Reilly guide to building fairness checks and privacy protections into real data science workflows.
Buy on Amazon
Book
Weapons of Math Destruction: How Big Data Increases Inequality and Threatens Democracy
Cathy O'Neil's accessible account of how opaque scoring models harm people, useful context for the cases in this guide.
Buy on AmazonKey Insights on AI Bias Audits
- A widely used health-care algorithm flagged only 17.7 percent of high-risk Black patients for extra care, versus 46.5 percent once its cost-based bias was removed.
- ProPublica found COMPAS wrongly labeled 44.9 percent of Black defendants who did not reoffend as higher risk, nearly double the 23.5 percent rate for white defendants.
- Commercial gender classifiers erred up to 34.7 percent of the time on darker-skinned women but only 0.3 percent on lighter-skinned men, so one accuracy figure hides the harm.
- Language models ranking resumes preferred white-associated names 85 percent of the time against 9 percent for Black-associated names, across more than three million comparisons.
- iTutorGroup's software automatically rejected older applicants, and the company agreed to pay $365,000 to settle an EEOC suit covering more than 200 qualified people.
- Federal guidelines treat a selection rate below four-fifths of the highest group's rate as evidence of adverse impact, which makes the impact ratio the first number auditors compute.
- Mathematically, three natural fairness conditions cannot be satisfied together except in tightly constrained special cases, so every audit must justify the one metric it prioritizes.
- Amazon's experimental recruiting model, started in 2014, penalized resumes containing the word women's and was abandoned, showing that removing a single flagged term cannot guarantee neutrality.
Taken together, these figures show that unfairness in automated decisions is measurable, recurring, and rarely visible in aggregate accuracy. The health, justice, hiring, and vision examples differ in domain but share a pattern, which is a convenient proxy, a skewed sample, or an unexamined threshold. AI Bias Audits: How to Test Models for Fairness therefore begins with disaggregation, because averages conceal exactly the groups that bear the harm. The mathematical limits on fairness mean that every team must choose a metric deliberately and defend the choice in writing. Legal exposure turns that written record into a practical asset, as settlements and certified collective actions now demonstrate. Organizations that treat auditing as part of responsible AI governance frameworks will find the evidence they need already on file.
| Dimension | Demographic parity | Equal opportunity | Equalized odds | Calibration by group |
|---|---|---|---|---|
| What it equalizes | Selection rate across groups | True positive rate across groups | True positive and false positive rates | Meaning of a score across groups |
| Needs ground truth labels | No | Yes, for positive cases | Yes, for all cases | Yes, for all cases |
| Typical decision | Hiring screens and loan approvals | Admissions where qualified people must be found | Risk flags where false alarms carry real costs | Risk scores that humans interpret |
| Main strength | Simple and maps to the impact ratio | Protects qualified individuals from being missed | Balances both kinds of error | Keeps scores trustworthy as probabilities |
| Main weakness | Ignores real differences in qualification | Says nothing about false positives | Stricter and can cost overall accuracy | Can coexist with unequal error rates |
| Tension with other metrics | Conflicts with calibration when base rates differ | Can conflict with parity and precision | Conflicts with calibration when base rates differ | Conflicts with equalized odds when base rates differ |
| Fairlearn measurement | demographic_parity_difference and ratio | true_positive_rate inside MetricFrame | equalized_odds_difference and ratio | Scikit-learn calibration curves by group |
| Fairlearn mitigation | ExponentiatedGradient and ThresholdOptimizer | ThresholdOptimizer with TPR parity | ExponentiatedGradient and ThresholdOptimizer | No dedicated mitigation algorithm |
AI Fairness Testing in Practice: Three Real Examples
Gender Shades and the Audit of Face Classifiers
Among the best-known audits, Joy Buolamwini and Timnit Gebru built a benchmark balanced by skin type and gender, then ran three commercial gender classifiers against it. The results showed that darker-skinned women were misclassified far more often than lighter-skinned men. Error rates for darker-skinned women reached 20.8 percent for Microsoft, 34.5 percent for Face++, and 34.7 percent for IBM. Lighter-skinned men saw errors between 0 and 0.8 percent on the same systems. The audit worked because it disaggregated by an intersection of two attributes instead of reporting overall accuracy. As the authors explain on the Gender Shades project site, a limitation is that the study covered one task and used binary gender labels. The result cannot speak to every face analysis product, which is why teams should rerun the test on their own systems.
The University of Washington Resume Ranking Test
Researchers at the University of Washington ran a controlled audit of how language models rank resumes, varying only the first name. They used more than 550 real resumes, 120 first names, and over 500 job listings in nine occupations, which produced more than three million comparisons. White-associated names were preferred 85 percent of the time and Black-associated names only 9 percent. Female-associated names were preferred 11 percent of the time against 52 percent for male-associated names. The design is easy to copy, because any team can rerun the same paired test against its own screening model. One limitation is that the experiment isolated names in a ranking task, which is narrower than a complete hiring process with human review, as the University of Washington summary notes.
ProPublica's COMPAS Error Analysis
ProPublica journalists obtained risk scores for more than 7,000 people arrested in Broward County, Florida, in 2013 and 2014, and compared predictions with two-year outcomes. They found that the tool correctly predicted recidivism about 61 percent of the time. Among defendants who did not reoffend, 44.9 percent of Black defendants had been labeled higher risk, against 23.5 percent of white defendants. Among those who did reoffend, 47.7 percent of white defendants had been labeled lower risk, against 28.0 percent of Black defendants. The analysis implemented the false positive and false negative comparison that is now standard in fairness audits. The developer disputed the framing, arguing that calibration across groups was the right standard, and that disagreement is a critique that every auditor should understand, as the ProPublica investigation acknowledges.
Lessons From Three High-Profile Bias Cases
Case Study: A Health-Care Algorithm and the Cost Proxy
Given the scale of the problem, hospitals and insurers needed a way to decide which patients should enter high-risk care management programs. They adopted a commercial algorithm that predicted future health costs as a stand-in for medical need. The problem was that Black patients generated lower costs than white patients at the same level of illness. The score therefore understated how sick they really were at each level. Researchers audited the tool by comparing scores with direct measures of health, and they found that at any given score Black patients were considerably sicker. As reported in the Science study abstract, removing the bias would raise the share of Black patients receiving extra help from 17.7 percent to 46.5 percent.
The solution the authors pursued was to change the label rather than patch the output, by working with the developer toward a target closer to actual health needs. That choice illustrates a core audit lesson, which is that the target variable is often the real defect. A limitation is that the audit depended on linking scores to clinical outcomes from a single health system, access that most outside reviewers lack. The case also remains contested ground for the wider field, because the same cost-proxy logic appears in many other tools. We explore those wider concerns in our look at ethical concerns in AI healthcare. Any team that predicts spending, arrests, or clicks as a proxy should rerun this style of check.
Case Study: Amazon's Abandoned Recruiting Engine
Amazon needed to sort a flood of resumes, so a team in Edinburgh developed an experimental model starting in 2014. The model gave candidates one to five stars, much like product ratings on the retail site. The problem surfaced when engineers found that it penalized resumes containing the word women's, such as a women's chess club captain. It also downgraded graduates of two all-women's colleges and favored verbs more common on male engineers' resumes. Engineers edited the programs to neutralize those specific terms, but they could not be sure that other forms of bias would not emerge.
The measurable result was a reduction in scope, because executives lost hope in the project and the team was disbanded. According to CNBC's report on the scrapped tool, Amazon kept only a much watered-down version for basic tasks such as removing duplicate candidate profiles. The lesson is that historical outcomes teach a model to reproduce the past. Patching individual features is a weak defense against proxies that encode the same signal in other words. The company deserves credit for testing and stopping the project. Still, the public learned of it only through reporting, which is a transparency concern in its own right.
Case Study: The Workday Age Discrimination Collective Action
Derek Mobley, an African American man over 40, alleges that he was rejected from more than 100 positions after applying through employers that used Workday's screening tools. The central problem, as pleaded, is that automated screening recommendations may disadvantage applicants aged 40 and over under the Age Discrimination in Employment Act. The theory is disparate impact, which does not require proof that anyone intended to discriminate. The vendor had built and sold the tools to many employers, which raised the novel question of whether a software provider can be liable in hiring. The court in the Northern District of California preliminarily certified a collective of applicants aged 40 and older who were denied employment recommendations. That ruling allows court-approved notice so that other applicants can opt in.
The limits of the ruling matter for anyone planning an audit. The certification is preliminary, and the court has not decided whether the tools actually caused a disparate impact, so the merits remain open. The court narrowed the collective definition and asked the parties to clarify what counts as a recommendation, a detail that remains contested. If certified broadly, such a collective could plausibly reach into the millions of applicants, which explains the high stakes for vendors and employers alike. The practical lesson is to audit selection rates by age band as well as by race and gender. This employment law analysis of the certification summarizes the open issues.
Common Questions About AI Bias Audits and Fairness Testing
An AI bias audit is a structured test of whether a model's decisions and errors differ across demographic groups. AI bias audits: how to test models for fairness starts with a scoping document, pre-registered metrics, and a representative evaluation set. The audit compares selection rates and error rates for each group and reports gaps with confidence intervals. The final record states what was found, what was decided, and who owns the response.
Audit before launch, after any major retraining, and on a fixed schedule for as long as the model is in use. New York City's rule requires an audit within one year before a covered hiring tool is used. High-stakes systems deserve more frequent checks, plus automated monitoring of selection rates on live traffic. Any change in the applicant pool, data source, or decision threshold should trigger a fresh review.
Use an independent party whenever the law or the stakes require credibility, such as a regulated hiring tool or a public-sector system. Internal teams can run frequent technical checks, provided the reviewers did not build the model. A good audit team mixes data scientists, domain experts, legal counsel, and people who understand the affected communities. Independence matters because an auditor who depends on the vendor's goodwill may soften unwelcome findings.
The right metric depends on the harm the system can cause. Selection rate ratios suit allocation decisions such as hiring, equal opportunity suits cases where qualified people must be found, and equalized odds suits cases where false alarms are costly. Report several metrics together and state clearly which one you prioritized and why. Mathematical results show that you cannot satisfy every definition at once, so the choice must be explicit.
The four-fifths rule is a United States employment guideline that treats a group's selection rate below 80 percent of the highest group's rate as evidence of adverse impact. You compute it by dividing one rate by the other. It is a screening heuristic, not proof of discrimination or proof of fairness. Pair it with significance tests and error rate comparisons, and see our note on <a href="https://www.aiplusinfo.com/blog/ai-law-ignored-in-nyc-hiring/" target="_blank" rel="noopener">how New York's hiring law is enforced</a>.
Yes, but only with clear limits and with full disclosure of the method. Counterfactual and paired tests, such as swapping names in otherwise identical resumes, need no stored demographic labels. Researchers sometimes estimate group membership from surname and geography, which adds error that you must report. Where the law permits, collecting self-reported attributes in a separate, access-controlled store gives the most reliable results.
There is no universal minimum, because the required size depends on the base rate and the effect you want to detect. As a rule of thumb, a group of a few dozen people cannot support a precise error rate. Compute bootstrap or exact confidence intervals and treat wide intervals as a finding. Mark any slice that falls below your pre-registered minimum as inconclusive instead of silently dropping it.
No, because other features in the data often act as proxies for the removed attribute. Zip code, school, purchase history, and even writing style can reconstruct race, gender, or age. Removing the column also blinds you to the disparity, which makes testing harder. Keep protected attributes in the evaluation table, exclude them from model inputs where appropriate, and measure outcomes by group.
Use paired or counterfactual prompts that change only a demographic cue, such as a name, and compare outcomes across many repeated runs. A University of Washington study of resume ranking used this design with more than three million comparisons. Test the full deployed system including prompts and retrieval, and score open-ended outputs with a documented rubric. Cross attributes such as race and gender to catch intersectional effects.
The answer depends on the jurisdiction, the industry, and the specific use case. New York City requires audits of covered automated employment decision tools, and the EU AI Act requires bias examination of data for high-risk systems. Colorado's law adds duties for high-risk deployers, summarized in <a href="https://www.aiplusinfo.com/blog/colorado-ai-act-compliance-guide/" target="_blank" rel="noopener">our Colorado AI Act compliance guide</a>. Even where no statute applies, anti-discrimination law still covers algorithmic decisions.
First confirm the finding with confidence intervals and a check for data errors. Then trace the cause through error analysis, since the fix differs for a biased label, a skewed sample, or a proxy feature. Choose a remedy, from data collection to threshold adjustment, and rerun the audit on fresh data. Record the decision and the owner, and read <a href="https://www.aiplusinfo.com/blog/ai-governance-trends-and-regulations/" target="_blank" rel="noopener">our overview of AI governance trends</a> to align with current expectations.
Often yes, because many disparities come from data or label problems that hurt accuracy as well as fairness. Fixing a cost proxy or collecting better data can improve both. When a real tradeoff exists, group-specific thresholds or constraints may cost some overall accuracy. Report the tradeoff curve so decision makers choose the operating point knowingly, a habit that <a href="https://www.aiplusinfo.com/blog/responsible-ai-can-equip-businesses-for-success/" target="_blank" rel="noopener">responsible AI programs</a> encourage.
A focused audit of one classifier with clean data can take a few weeks, while a complex system with missing demographic labels can take months. Scoping and data preparation usually consume more time than the metric computation itself. Automating the metric pipeline makes every later audit much faster and cheaper to repeat. Planning AI bias audits: how to test models for fairness as a recurring process turns that initial investment into a reusable asset.