
Introduction
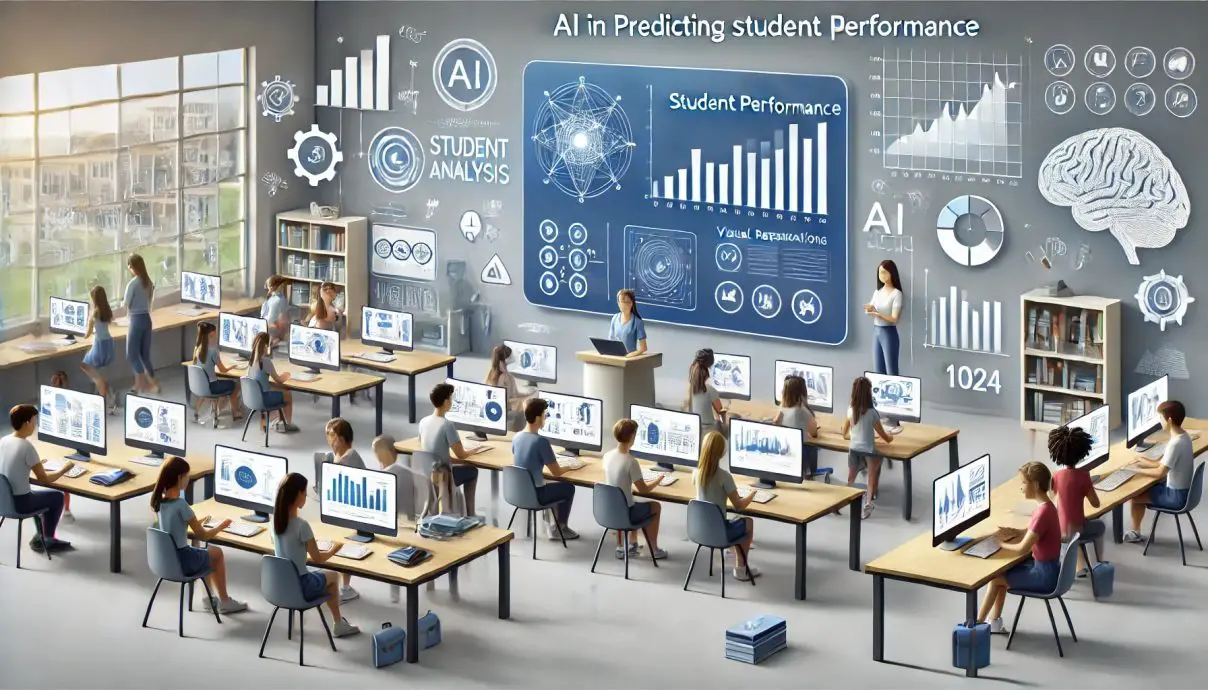
Student Performance Prediction with AI has moved from research novelty into live operational practice across colleges, districts, and online learning platforms. The Open University in the United Kingdom now applies predictive analytics to 118,963 students through its OU Analyse system. Georgia State University has used daily analytics across hundreds of signals to raise six-year graduation rates by double-digit percentage points over the past decade. Classroom teachers, academic advisors, and institutional researchers now see model-generated risk scores for every learner on their roster. The core promise is early intervention, before a student drops a course or walks away from a degree entirely. The real question is whether these systems are accurate enough, fair enough, and transparent enough to deserve the trust placed in them. This guide walks through the data, the models, the deployment choices, the ethical fault lines, and the measured outcomes institutions actually see.
Quick Answers on Predicting Student Outcomes
What is student performance prediction with AI?
Student performance prediction with AI applies machine learning to grade, attendance, and digital trace data. Models produce a risk score that triggers advisor intervention before a failing grade lands on a transcript.
How accurate are these models in practice today?
Predictive student models reach AUC scores between 0.75 and 0.90 on first-term dropout. Accuracy drops across institutions, so local recalibration matters more than algorithm choice.
Is predictive student scoring legal under FERPA?
Yes, student performance prediction with AI operates under FERPA when the vendor is a school official. Written consent is still required for secondary research use outside the direct education record.
Key Takeaways
- Modern student performance prediction combines LMS clickstream data, grades, attendance, and prior academic history inside gradient-boosted or neural models tuned on each institution.
- Early warning systems deliver real retention gains only when the model output feeds a trained advisor and an intervention workflow, not a passive dashboard.
- Bias audits, FERPA controls, and student-facing explanations are now the price of operating these systems at scale, not optional extras bolted on later.
- Generative AI is beginning to layer natural-language coaching on top of the classical risk-score model, blurring the line between prediction and tutoring.
Table of contents
- Introduction
- Quick Answers on Predicting Student Outcomes
- Key Takeaways
- What Is Student Performance Prediction with AI in Modern Classrooms
- The Data Pipeline Behind Every Prediction Model
- Machine Learning Algorithms That Shape Educational Forecasts
- Deep Learning and Neural Networks in Grade Prediction
- Natural Language Processing of Student Writing and Discussion Posts
- Early Warning Systems That Flag Students Before They Fall Behind
- Personalized Learning Pathways Driven by Predictive Signals
- Integration With Learning Management Systems and Student Information Systems
- Teacher Dashboards and the Human in the Loop Review
- Equity, Ethics, and the Risk of Algorithmic Discrimination
- Privacy Law, FERPA, and Student Data Rights
- Model Explainability for Students, Parents, and Advisors
- Implementation, Evaluation, and the Return on Investment Question
- The Future Horizon of Predictive Learning Analytics
- Key Insights on Predictive Learning Analytics
- Comparing Traditional and AI Driven Student Prediction Approaches
- Classroom Examples of Predictive Student Models in Practice
- Case Lessons From Institutions Scaling Predictive Analytics
- Frequently Asked Questions About Student Performance Prediction with AI
What Is Student Performance Prediction with AI in Modern Classrooms
Student Performance Prediction with AI uses machine learning on student records and digital trace data to forecast grades and dropout risk, triggering intervention before the outcome is locked in.
Interactive risk simulator for a hypothetical student
Explore how input signals move a predicted risk score
82%
6
2.8
15
Standard
Predicted term risk score
32
Low risk, continue standard support rhythm.
The Data Pipeline Behind Every Prediction Model
Building on that institutional context, every predictive system starts with a data pipeline that pulls records from the student information system and the learning management system. Student Information Systems supply demographic data, prior grades, financial aid flags, and course registrations across every term the learner has attended. Learning Management Systems contribute minute-level clickstream records, assignment timestamps, forum participation counts, and video dwell times for each course interaction. The feature engineering step converts raw events into model-ready predictors such as weekly login frequency, median time to assignment, and quiz score trajectory. A feature store caches these predictors so training jobs and nightly scoring jobs read the same values, preventing training-serving skew. Data quality rules reject records with missing identifiers, blocking silent misalignment between the demographic feed and the behavioral stream.
Pipeline design decisions set the ceiling on model accuracy more decisively than algorithm choice ever does. Identifier mapping across the SIS and the LMS is the single largest source of silent data loss across most campus deployments. A student who enrolls under a maiden name and logs into the LMS under a legal name produces two shadow records and no features. Timezone drift between systems adds hidden lag, so a Tuesday assignment appears on Monday in some rows and Wednesday in others. Each of these quirks degrades features without raising an error, so the model simply learns from a less complete picture. Teams that invest in a shared identity resolution layer see noticeable gains before any new model is even trained.
Beyond the raw signals, labeling defines what the model is actually predicting across every course term and every student cohort. A withdrawal flag can mean the student dropped the course, dropped the term, took a leave of absence, or stopped enrolling without filing paperwork. Mislabeled withdrawals produce confused training targets, so models learn to predict a mix of situations that call for very different interventions. Labeling guidelines must be documented alongside the data dictionary, and label review should be a recurring task owned by the registrar team. Prediction windows also matter, since a two-week horizon rewards short-term features while an end-of-term horizon rewards sustained engagement patterns. The clearest institutions publish their labeling rules in an internal wiki so advisors understand what the risk score actually means.
Retraining cadence closes the loop between data drift and model relevance across each academic year, so the pipeline cannot be a one-time build. A new catalog of general-education courses can shift feature distributions overnight, breaking a model trained on the previous curriculum. Nightly scoring jobs are standard, but model refreshes happen weekly in some vendors and quarterly in others, so caution scales with the gap. Audit logs record every input and every prediction so a student who contests a score can later see what the system saw. Successful teams track performance over time with group-level AUC, calibration plots, and demographic parity, not just a single overall accuracy number. The pipeline is a living product, not a finished project, and predictive analytics for student retention fails whenever that distinction is ignored.
Machine Learning Algorithms That Shape Educational Forecasts
Turning to algorithm selection, most production student risk models still rely on tree-based ensembles rather than deep neural networks. Gradient boosted decision trees, carried by libraries such as XGBoost and LightGBM, dominate the Kaggle leaderboards on tabular academic data. These ensembles handle missing features gracefully, which matters because student records are riddled with blanks across financial aid and demographic fields. Logistic regression remains the baseline that every new model has to beat before anyone considers pushing it into production. Random forests work well when the engineering team wants variance control without the hyperparameter tuning that gradient boosting demands. Simpler models also win on explainability, which is one reason regression stays alive long after neural networks dominate every academic headline.
Algorithm choice matters less than feature quality for most student prediction use cases on campus today. A median university sees larger accuracy swings from adding attendance signals than from switching between random forest and gradient boosting. Feature engineering gains translate directly to model accuracy, while algorithmic gains plateau quickly once the data pipeline is clean. That said, class imbalance is severe in dropout prediction, since most students pass courses and few actually fail. SMOTE oversampling, class weighting, and focal loss functions all help, but each has side effects on calibration that teams must monitor. The right algorithm is whatever balances accuracy, calibration, and auditability for the specific intervention workflow the model is meant to serve.
Hyperparameter tuning rarely delivers the gains that teams expect, so investing time in cross-validated search often beats raw accuracy chasing. A thoughtful train-validation-test split that respects the time dimension matters more than the particular tree depth or learning rate chosen. Leakage from future information is the quiet killer of academic models, as a feature computed after the label date silently inflates every metric. Nested cross-validation across terms is the standard defense, since a model that holds up term over term is the one worth deploying. Teams that read machine learning in education primers tend to pick the right baseline first. The best signal that a model is ready for scoring is a holdout AUC that stays stable across three independent academic terms.
Deep Learning and Neural Networks in Grade Prediction
Shifting to deep learning, neural approaches have gained ground where sequence structure in the data carries predictive signal. Long short-term memory networks model weekly engagement sequences, capturing the slow decline that often precedes a formal withdrawal. Transformer encoders process the full event log of a course term and learn interactions that hand-crafted features often miss. Graph neural networks represent the social structure of discussion forums and lab groups, surfacing peer-effects that tabular models cannot see. These architectures demand more data, more compute, and more careful validation than the ensembles they replace. In institutions with over 50,000 enrolled students per term, deep learning begins to deliver a measurable accuracy advantage worth the engineering cost.
The accuracy gain from a transformer over a boosted tree is typically a few points, not an order of magnitude. That delta is sometimes worth the operational cost, and sometimes not, depending on how large the student body is. Smaller colleges often get more value from investing in better features and a stable advisor workflow than from upgrading their model class. Research institutions with dedicated data-science teams can experiment with hybrid architectures that stack tabular ensembles under a neural encoder. Overfitting is a constant threat because student samples are small by machine-learning standards and the label distribution shifts between terms. Teams exploring collaborative learning with AI tools often validate predictive models on three terms of held-out data.
Natural Language Processing of Student Writing and Discussion Posts
Beyond quantitative features, natural language processing extracts signal from the open-ended writing students produce throughout a course term. Essay drafts, discussion posts, forum questions, and reflection journals each carry information that no clickstream feature can replicate. Transformer language models encode these texts into vectors that capture topical coherence, sentiment, and reasoning depth across the whole corpus. A sudden decline in reasoning depth or an uptick in confusion markers can precede a drop in exam scores by several weeks. Topic drift between the course objective and student writing is a strong signal that the learner has lost the thread of the material. These NLP features are usually appended to the tabular feature store, so the main predictor still runs on the standard ensemble.
The hardest part of educational NLP is deciding what counts as a learning signal versus a personality signal in student writing. A terse writer who hits every mark deserves no risk flag, while a verbose writer who misses the point of the prompt may need help. Models that confuse style with substance will flag the wrong students and ignore the ones who most need support. Human-reviewed training labels, including feedback from writing-center tutors, help models learn what deep understanding actually looks like in prose. Faculty often resist handing over student writing for machine inspection, so institutions must address consent and secondary-use rules carefully. The AI in student assessment and grading discourse has mapped much of this ground.
Looking at the operational side, NLP features add noticeable compute cost and introduce new failure modes the engineering team must manage. Running a transformer over every discussion post for every student in a 60,000-learner institution is not a background job. Model drift from new course topics is quicker than drift from new attendance patterns, so NLP features require more frequent retraining. Vendors that promise plug-and-play writing analytics often undersell the labeling and oversight work the institution must still carry out. A small quality team that reviews a weekly sample of flagged writing catches most problems before they contaminate advisor dashboards. Mature pipelines log every prediction with a traceable version so a student complaint can be reproduced at any point in the term.
Early Warning Systems That Flag Students Before They Fall Behind
Stepping back from the data-science details, the deployed artifact that matters most is the early-warning system teachers and advisors actually use. An early-warning system compiles risk scores into a prioritized list of students who need outreach this week. Advisors see a short justification for every score, so they can decide which signal to raise in the first conversation. The system schedules follow-ups, logs outcomes, and feeds those outcomes back into the model as supervised labels. A good early-warning tool is a workflow, not a dashboard, and that distinction decides whether retention actually moves. Teams that treat the dashboard as the deliverable see no retention lift, because no advisor acts on a passive risk list.
The hardest design choice is the threshold where a score becomes an alert, since every threshold trades false positives against missed interventions. A low threshold floods advisors with alerts and burns out the human review step within a few weeks. A high threshold misses borderline students who would have responded to a nudge, so the model never gets credit for easier wins. Threshold calibration is a product decision that belongs to the student success office, not the data science team alone. Many institutions run a tiered alert design, where the top one percent get an immediate call and the next five percent get an email nudge. The real-time feedback for students using AI literature covers these tiered designs in depth.
For teams scaling early warning across many courses at once, the integration surface matters as much as the model itself in daily operation. A great model that lives in a separate portal rarely gets opened by advisors who already have five tabs of institutional tools open. Risk scores belonging in the advisor case management workflow show up next to transcripts and schedules, where decisions actually happen. Push notifications on a tight schedule beat weekly email digests, since many time-sensitive interventions have a window of only a few days. The signal that a system is working is a rising rate of logged interventions per flagged student, not a rising rate of flags. Rising flag counts without rising intervention counts is a cost center, not a student-success program worth defending to the board.
From there, outcome measurement closes the loop so leadership can see what intervention actually produced across each cohort. A quasi-experimental design compares flagged students who received outreach with flagged students in a comparison cohort who did not. Full randomization is often unethical because withholding a known-helpful intervention cannot be defended in a hearing with families. Propensity-matched analysis remains the standard pragmatic choice when randomization is off the table for an institution. Retention gains in the one to three percentage-point range per cohort are plausible, measurable, and defensible to a provost. Predictive analytics only earns renewal when institutions can show this chain of evidence to their board of trustees each year.
Personalized Learning Pathways Driven by Predictive Signals
Looking ahead to the output side, prediction scores can also drive personalization of learning content and support services. An adaptive tutoring platform can route a flagged algebra student toward a prerequisite review module before the next quiz lands. A content recommendation engine can suggest practice problems that target the sub-skills where the current prediction suggests gaps. These personalized paths work only when the underlying content library is granular enough to match the sub-skill resolution of the predictor. Coarse content libraries produce coarse recommendations that students experience as random assignments rather than targeted help. Investments in content taxonomy pay off in personalization long after the model itself has been upgraded or replaced.
Personalization fails whenever the model and the content library speak different languages about student skills. The predictor may know a student is weak on linear equations, but if content is tagged only at the chapter level, the suggestion is off-target. Shared taxonomies tied to formal competency frameworks keep model outputs and library tags aligned across every term update. Mapping each item to the specific learning objective it supports is painful work, and vendors routinely cut this corner. The AI tools for personalized education field has matured on this point in the last five years. A well-tagged library turns a middling prediction into a precise intervention and lifts outcomes without a single model change.
Integration With Learning Management Systems and Student Information Systems
Shifting to integration, predictive scoring only works when risk signals reach the systems educators already live in. Canvas, Blackboard, Moodle, D2L, and Schoology each offer different levels of extension through plug-ins, LTI tools, and REST APIs. A tight integration surfaces the risk score next to each student roster, so a teacher sees context without leaving the gradebook. Loose integrations deliver a PDF of flagged students once a week, which few teachers open after the first month of a term. Student Information Systems such as Banner, PeopleSoft, Workday Student, and Jenzabar hold the demographic and enrollment feeds the model needs. Each SIS vendor offers a different licensing model for the underlying feed, and those licensing choices directly shape pipeline design.
Integration is where many pilot projects quietly die after the data science team finishes a working model. Enterprise architects worry about system load, security, and governance in ways that pilot teams rarely plan for ahead of time. A read-only replica of the SIS prevents the model from stressing a system that enrollment and financial aid rely on daily. Single sign-on through the campus identity provider enables advisor access without creating another credential to manage. FERPA audit logs must capture every risk-score lookup, so the institution can show downstream access review during periodic audits. These architectural choices often decide project success more than any accuracy decimal places the model team ships that quarter.
Beyond the big enterprise LMS, specialized tools for specific populations now carry prediction features natively inside their user interface. Online program manager platforms such as 2U and Noodle Partners embed risk scoring into enrollment coaching flows. Community college success platforms like Civitas and Starfish bundle alerts, scheduling, and advisor case management in one offering. K-12 LMS vendors are now embedding predictive scoring in gradebook views, so grade-school teachers see the same signals as college advisors. Each embedded tool reduces custom integration work but also reduces how much the institution can tune the model to local context. Buy versus build becomes a strategic question that the chief information officer answers with the student success office together.
Teacher Dashboards and the Human in the Loop Review
On top of the integration, the teacher dashboard is where the model meets the professional who actually knows the student in person. A dashboard that shows a bare risk score invites either over-reliance or dismissal, with few teachers landing in the thoughtful middle. The best dashboards show the top three contributing features for every score, so a teacher can see what the system actually noticed. A quick override button lets the teacher mark a flag as context already handled, so advisor outreach is not duplicated unnecessarily. A trend arrow alongside the risk score captures direction of travel, which carries far more operational meaning than the current level alone. Teachers who use these views regularly tend to spot pattern changes earlier than teachers reading the raw gradebook.
Human in the loop review is where predictive analytics becomes an educational practice rather than a surveillance mechanism. Advisor notes, teacher comments, and student self-reports feed back into the system so the model learns what intervention actually helped. This feedback loop is the lever that moves accuracy, since purely algorithmic retraining captures only what the data already knows. Teachers who feel ignored by a model will stop updating it, so the loop breaks and the model slowly drifts away from reality. Involving faculty in the design of override reasons and intervention tags keeps the loop alive across term after term. Programs that treat AI-powered tutoring systems as collaborative, not autonomous, tend to retain faculty support for longer.
Equity, Ethics, and the Risk of Algorithmic Discrimination
Moving on to the harder questions, equity is the dimension on which student performance prediction most often falls short in audit. Models trained on historical enrollment data will reproduce the inequities baked into prior admissions, grading, and support decisions. A model that uses zip code as a proxy will systematically assign higher risk to students from historically under-resourced neighborhoods. That score then triggers more intervention for some, more surveillance for others, and advisor attention that may feel burdensome to targeted groups. Fairness metrics such as demographic parity, equal opportunity, and calibration should be computed per cohort at every retraining cycle. Groups that fall outside a chosen tolerance band deserve explicit notice and either a model fix, a feature removal, or a halt on scoring.
Fairness is a design decision, not an afterthought, and the fairness definition chosen will shape every intervention downstream. Equal opportunity treats true positives as the parity target, meaning the system misses struggling students at the same rate across groups. Predictive parity treats positive predictive value as the target, meaning a flag means the same thing for every demographic cohort. These two definitions can be mathematically impossible to satisfy at the same time, which forces a trade-off every institution must own. Publishing the fairness choice in a student-facing policy keeps the decision open to challenge, which is the heart of democratic accountability. The AI bias audits in modeling literature has formalized how to make these choices visible.
For teams carrying out these audits, data stratification across race, gender, Pell status, first-generation status, and disability status is the baseline. Each stratification cell must have enough samples for stable estimates, which forces aggregation choices that can hide local inequities. Intersectional analysis across pairs of attributes often reveals patterns the single-attribute view will miss, especially for small subgroups. External auditors with no stake in model outcomes bring a fresh perspective, and some systems now require that layer by policy. The ethical issues of AI in education community has advanced the practice considerably in recent years. An institution that cannot defend its fairness methodology in writing should not operate a predictive system over its own students.
Privacy Law, FERPA, and Student Data Rights
Despite the equity picture, legal risk under FERPA and newer state privacy statutes is the regulatory anchor administrators actually watch. FERPA permits schools to share student records with vendors acting as school officials with a legitimate educational interest. That doctrine shields most vendor contracts, provided the vendor cannot sell or repurpose the data outside the scope of the agreement. State laws such as California AB 1584 and New York Education Law 2-d layer additional controls on top of FERPA for K-12 students. The GDPR applies to any European student record, including international students enrolled at a United States university. Legal review of every vendor contract has become a standard precondition for any new deployment of predictive learning analytics on campus today.
Written consent remains the gold standard whenever data use leaves the direct education record and heads into research or marketing. Students should see what data the institution collects, who sees the score, and how long records are retained. A plain-language disclosure linked from the LMS log-in screen is the floor, not the ceiling, of what transparency should look like. Right-to-explain requests under state law force institutions to describe why a specific student received a specific risk score at a specific moment. The safeguarding student privacy with AI tools policy guides have become essential reading. Institutions that lead on consent capture every advantage of goodwill with families when the inevitable press inquiry arrives.
Beyond the big policy debates, data retention periods also carry weight in a modern privacy posture across every connected system. A ten-year retention default means a graduate from 2020 is still inside the model training set in 2030, which few students expect. Shorter retention windows reduce legal risk, reduce model stability, and force teams to think explicitly about which data is actually essential. Pseudonymization and differential privacy are becoming vendor features that let analytics run without exposing identifiable records to data scientists. Breach notification laws now impose fines in the hundreds of thousands of dollars for institutions that lose student records to attackers. A security review and penetration test should run alongside every new predictive deployment, not after the first incident forces one.
Model Explainability for Students, Parents, and Advisors
With that policy context in mind, explainability now shapes whether a predictive system can survive family and student scrutiny over time. A score alone invites either compliance or complaint, with little space for the student to engage constructively with the result. SHAP values decompose a prediction into feature contributions so a teacher can say which signal pushed the number up this term. Counterfactual explanations say what change would have moved the score, which gives the student a concrete action to take next week. Natural-language summaries can bundle feature contributions into a two-sentence explanation that an advisor emails to the student without rewriting. Vendors increasingly ship these explanation layers out of the box, so institutions no longer need to build them from first principles.
Student-facing explanations differ from advisor-facing explanations, and both differ from the technical explanations the data team sees daily. A student needs an actionable step framed in the vocabulary of their course and their life, not the vocabulary of the model. An advisor needs enough feature context to prepare for an outreach conversation that lands with the student. A data scientist needs the raw feature contributions and the base rate, so they can diagnose shifts in model behavior over time. Treating explanation as one artifact for all three audiences is a common mistake that undercuts adoption on every side. Programs built with role-specific explanations earn more durable support than those offering a single opaque dashboard to every stakeholder.
Implementation, Evaluation, and the Return on Investment Question
Given the architectural depth, deployment economics decide whether predictive systems earn a renewal budget after the pilot year. Vendor platforms range from roughly 10 to 60 dollars per student per year, depending on scale, included services, and feature breadth. In-house builds can be cheaper per student at scale but require a data engineer, a data scientist, and an analyst to sustain. Opportunity costs matter too, since those staff could instead support financial aid analytics or operational reporting elsewhere on campus. A rigorous business case compares additional retained tuition revenue against the cost of staff, software, and oversight across three academic years. The payback period often lands between 18 and 36 months on honest math, with wide variance depending on prior retention baselines.
Evaluation discipline separates deployments that renew from deployments quietly shelved after the pilot term. Pre-registered outcomes, published fairness audits, and quarterly performance reports keep the system accountable throughout the year. Comparison cohorts, propensity matching, and intention-to-treat framing are the standard tools for serious impact estimation. Vendor-supplied impact numbers deserve skepticism, since vendors routinely cherry-pick the most favorable analytical window and ignore cohort selection. Internal institutional research offices know how to pressure-test these numbers, and bringing them in early builds credibility with faculty governance. The institutions that publish their methodology also tend to publish honest limitations, which does more for trust than any marketing deck.
Among the quieter deployment questions, change management often determines whether advisors actually use the system each week. A rollout plan with named advisor champions, weekly check-ins, and a shared Slack channel outperforms a top-down launch every time. Training that focuses on sample case workflows beats training that focuses on screen navigation, since the workflow is what carries value. Celebrating the first retained-student story in a town-hall format builds momentum far beyond what a usage dashboard will ever convey. Predictive analytics pays off when organizational practice evolves alongside the model, not just when the model ships into production. Programs that invest the equivalent of a model-training budget in change management see adoption rates roughly double the campus average.
The Future Horizon of Predictive Learning Analytics
Looking ahead, the next five years will reshape educational prediction around generative models and multimodal signals in surprising ways. Large language models can now draft personalized intervention messages, summarize advisor notes, and translate between languages at scale. Multimodal models that combine clickstream data with webcam engagement cues raise accuracy and raise ethical complexity in equal measure. Federated learning promises to let institutions share model weights without sharing raw student records, which could unlock cross-campus benchmarks. Synthetic data generation reduces reliance on sensitive records for model development, though validation on real cohorts still matters. The future of higher education with AI coverage sketches these shifts in considerable detail.
Generative AI will likely sit on top of classical predictive models, not replace them for the foreseeable future. A tree-based ensemble produces the calibrated risk score, and a language model translates that score into a message for the student. This separation of concerns gives institutions auditable risk estimates alongside flexible, humane communication at scale. Blurring the two layers tempts teams toward opaque, chatty tutoring systems that students, faculty, and regulators will struggle to oversee. The next regulatory wave in the United States and Europe will almost certainly require some version of this separation. Transparent architecture is becoming a competitive advantage, not a compliance burden, in a market increasingly skeptical of black-box tooling.
For teams reading recent research, longitudinal prediction across multiple terms is the live methodological frontier right now. A model that tracks a student from first-year math through capstone work must handle enrollment interruptions, major changes, and credit transfers. State-space models and continual learning techniques are showing early promise on these multi-term prediction tasks. The scarcity of long-horizon labeled data remains the bottleneck, since few institutions have published multi-year panels to the research community. International collaborations, such as the OU Analyse Erasmus consortium, are starting to assemble these cross-institution benchmarks. The generative AI and student agency work complements this empirical push with a policy lens.
From there, student agency itself is likely to become a design dimension rather than just a legal checkbox for institutions. Dashboards that let students see and shape their own risk picture create accountability without surveillance. Co-designed consent flows build trust with underrepresented student groups that have reason to be cautious of institutional data. The old model was that data flowed into prediction and intervention flowed back out to the student in one direction only. A newer, more durable model loops the student into the process from the start, including in choices about what features are even collected. Predictive learning analytics will stay viable long term only if it travels with student consent, not against it on campus.
Retention lift after predictive analytics deployment
Reported outcomes across four published institutional case studies
Source: AIplusInfo research synthesis based on Open University impact case and partner institution reports.
Key Insights on Predictive Learning Analytics
- Scaled coverage at the Open University impact case page shows OU Analyse now tracks 118,963 students across every undergraduate module after a seven-year rollout.
- Teacher engagement with OU Analyse on the Open University platform hits 56 percent retention for frequent users compared to 48 percent for occasional users.
- The Czech Technical University StudentAnalyse outcome cut first-year drop-out from 37 percent to 19 percent at the Faculty of Mechanical Engineering.
- Georgia State tracked over 800 risk factors every day, lifting six-year graduation rates by 23 points through sustained analytics and advising.
- The APLU Global Issues course report recorded a 20 percent DFW drop in Fall 2017 after instructors adopted adaptive analytics tools during the pilot.
- The DataIQ Award September 2020 recognition gave OU Analyse an external data-quality seal that supported wider institutional adoption throughout UK universities.
- Pre-pilot attrition at the Open University baseline measurement showed roughly 30 percent of students abandoned studies in year one over five academic years.
- An Open University panel April 2019 review formally recommended Predictive Learning Analytics across all faculties, scaling training to 3,581 tutors on undergraduate modules.
These numbers point at a clear pattern across the leading institutional deployments of predictive learning analytics in operation. Scale alone does not deliver outcomes, since teachers and advisors must use the signal often enough to make it operationally meaningful. The retention gap between regular users and occasional users of OU Analyse mirrors a broader lesson from behavioral economics about defaults and nudges. Public recognition such as the DataIQ award signals a maturing field that now expects documented methodology, not just internal champions. Georgia State and Czech Technical University both show that improvements come from pairing a model with a disciplined intervention workflow. Student performance prediction with AI is becoming a mainstream institutional capability, provided governance keeps pace with modeling ambition.
Comparing Traditional and AI Driven Student Prediction Approaches
Beyond the single-institution picture, a side-by-side comparison helps leaders position their current practice against alternative models. The table below contrasts advisor-only triage, rule-based alerts, and AI-driven prediction across seven dimensions decision makers care about. Each row captures a decision point that any institution evaluating these systems should document explicitly in writing. Column choices reflect the three options an academic leader will actually see on a vendor evaluation sheet at a budget meeting. The rows surface trade-offs that marketing materials rarely spell out with similar precision for executive readers. Reading this table alongside the examples and case studies that follow keeps the comparison grounded in real deployment data.
| Dimension | Advisor Triage Alone | Rule Based Alerts | AI Driven Prediction |
|---|---|---|---|
| Signal breadth | Teacher impression plus grade | Grade and attendance thresholds | Grades, LMS data, demographics, and writing |
| Timing of flag | After a failed assessment | After a threshold breach | Several weeks before a predicted failure |
| Coverage | Limited by advisor caseload | Course-wide but noisy | Full enrollment, calibrated per cohort |
| Fairness audit | Rare and informal | Possible but seldom done | Required at retraining, with group metrics |
| Explainability | Advisor intuition | Clear single rule | SHAP values plus counterfactual explanations |
| Operational cost | Advisor salary alone | Minor engineering | Platform fees, pipeline, and governance work |
| Measured retention lift | Hard to isolate | Small, context dependent | One to three points per cohort when deployed well |
| Student consent surface | Implicit through advising | Rarely surfaced | Explicit disclosure and right to explain |
Classroom Examples of Predictive Student Models in Practice
Faculty of Mechanical Engineering at Czech Technical University
Turning to concrete deployments, the Faculty of Mechanical Engineering rolled out StudentAnalyse to every incoming engineering cohort using the OU Analyse methodology adapted locally. Advisors used the risk scores to call students who missed early-term labs, since lab attendance was the strongest leading indicator in the data. The deployment reduced first-year drop-out from an average of 37 percent to 19 percent, keeping 422 additional students progressing to the second year. The implementation leaned on in-person outreach, so remote-only cohorts saw smaller gains than cohorts with campus-based support available weekly. A measurable limitation was advisor burnout, since the increased caseload required additional staffing that the faculty absorbed only after year two. The Open University impact case documentation credits StudentAnalyse with producing durable, measurable, cross-institutional retention improvements across the engineering programs.
Georgia State University Student Success Platform
Georgia State deployed daily analytics across more than 800 risk factors, pairing scores with proactive outreach from a dedicated advising team on campus. The university built scripted intervention paths, so an advisor who received a flag knew exactly which conversation to initiate within 48 hours. Six-year graduation rates rose by more than 20 percentage points across the following decade, with the largest gains concentrated among Pell-eligible students. The institution reorganized its advisor staffing and training in parallel, so attributing all gains to the predictive model alone would be misleading analytically. A measurable limitation was staff turnover during the rollout, since trained advisors needed replacements as the program scaled across every undergraduate college. The Government Technology case coverage of Georgia State documents implementation choices alongside outcomes carefully.
Adaptive Courseware Pilot in Georgia State General Education
The APLU adaptive courseware grant piloted analytics-driven course redesign in general education starting in 2017 with 1,761 students enrolled. Faculty rolled out adaptive software that generated real-time analytics on student mastery, which they used to retime instruction across the term. The Global Issues course saw DFW rates drop nearly 20 percent in Fall 2017, and success rates rose more than 10 points over the pre-pilot baseline. Scale reached 18,107 cumulative enrollments across the general education portfolio over the next two academic years at the university. A measurable limitation was uneven faculty adoption, with the APLU report noting that instructors underused the dashboard data for direct student intervention. The APLU Georgia State case study PDF walks through pilot design and outcome measurement step by step clearly.
Books that deepen a predictive analytics practice
Trusted titles for teams working on student outcomes with data

The Hundred-Page Machine Learning Book
A concise foundation on supervised models that institutional data teams can read in a weekend.
Buy on Amazon
Data Science for Business
A classroom-ready introduction to data-driven decision making that applies cleanly to student success work.
Buy on Amazon
Learning Analytics Goes to School: A Collaborative Approach to Improving Education
A collaborative framework for implementing learning analytics with practitioners inside real schools and systems.
Buy on AmazonAs an Amazon Associate, AIplusInfo earns from qualifying purchases.
Case Lessons From Institutions Scaling Predictive Analytics
Case Study: Open University UK and the OU Analyse Platform
Moving on to institutional deployments at scale, the Open University faced a severe retention problem before the pilots, since roughly 30 percent of students abandoned studies in year one. That rate was 20 percentage points above the UK higher education average, which pressured the institution to invest in data-driven intervention. The solution was OU Analyse, a predictive platform that flagged at-risk students every week based on virtual learning environment engagement and prior assessment scores. From November 2020, every one of the 3,581 undergraduate tutors received training to use the platform in their teaching routine. Learning analytics monitoring now applies to 118,963 students across the entire undergraduate curriculum of the university. A measurable limitation is that teacher usage drives outcomes, so retention gains concentrate in modules whose tutors engage with the platform regularly. The Open University impact case page provides the full timeline and the governance structure clearly.
Beyond the engagement data, the Open University review panel formally recommended Predictive Learning Analytics in all faculties in April 2019. OU Analyse won the DataIQ Award for best use of data by a not-for-profit organisation in September 2020, validating the methodology externally. Teacher feedback captured in the impact case highlights specific moments where OU Analyse prompted earlier contact with struggling students than business as usual. One cited tutor said that without the platform they would have lost around four or five students in a cohort who later passed. A measurable limitation is that the published outcomes depend heavily on self-reported teacher use rather than a controlled experimental design. This limitation does not negate the retention gains, but it does invite external replication by institutions with different student populations.
Case Study: Civitas Learning at Partner Community Colleges
Many community colleges struggled with first-term withdrawal rates above 20 percent, which created a persistent revenue and mission problem for leadership. The core challenge was that advisor caseloads of 500 students or more made proactive outreach practically impossible without triage information. The solution was Civitas Learning Illume, a predictive platform that scored every enrolled student weekly and pushed outreach prompts into advisor queues. Partner institutions implemented tiered outreach, with highest-risk students receiving a phone call and middle-risk students receiving an email nudge. Civitas has reported outcomes in the one to three percentage-point range on persistence across diverse community college partners over multiple cohorts. A measurable limitation is attribution complexity, since campuses that adopt predictive analytics usually revise their advising practice at the same time. The EDUCAUSE 2026 session agenda on AI and analytics for student success documents multiple Civitas partner outcomes transparently.
Case Study: Ellucian Student at Public University Systems
Large public university systems faced a procurement problem, since every campus had different data pipelines and different advisor workflows for intervention. The challenge was a lack of system-level predictive analytics that could operate consistently across campus boundaries for enrollment, retention, and graduation planning. Ellucian deployed Ellucian Student with embedded AI advising copilots, which integrated predictive scoring with institutional data warehouses and advisor case notes. The system now surfaces risk, nudges, and recommended actions directly inside the advisor workflow across multiple state university systems. Early adopters have reported higher advisor efficiency with reduced time spent reconciling data across systems, measured in weekly hours saved per advisor. A measurable limitation is vendor lock-in, since institutions that commit to Ellucian Student find portability of model logic and historical scores constrained. The EDUCAUSE 2026 Ellucian Student press release describes the product architecture and deployment partners in detail.
Frequently Asked Questions About Student Performance Prediction with AI
Student performance prediction with AI is the use of machine learning on student records to forecast grades and completion. It produces a risk score so advisors can act early. The underlying math is similar to credit-score models applied to education data instead. Most institutions treat it as a decision support tool rather than an automated grading system.
Gradient boosted decision trees and logistic regression dominate production student risk models today. Random forests and neural networks appear in larger institutions with dedicated data science teams. Transformer-based language models are starting to augment tabular predictors with signals from student writing. The exact choice matters less than the quality of the underlying feature engineering.
Published models report AUC scores between 0.75 and 0.90 on first-term dropout prediction tasks. Accuracy declines when models trained at one institution deploy at another without local recalibration. Calibration metrics such as expected calibration error matter as much as raw accuracy for decision support. Teams tracking group-level fairness alongside overall accuracy spot drift before leadership feels any surprise.
FERPA permits sharing records with vendors acting as school officials with a legitimate educational interest. Written contracts should prohibit any secondary use of records beyond the agreed educational purpose only. State laws such as California AB 1584 and New York Education Law 2-d add further protections. Institutions should run every vendor contract through counsel before any new predictive deployment goes live.
Fairness audits compute group-level metrics such as demographic parity and equal opportunity at every retraining cycle. Independent reviewers test models before deployment and periodically throughout the operational lifetime of the system. Published fairness policies describe the chosen definition and the trade-offs that definition entails. Students who feel misclassified should have a documented path to challenge their risk score.
Leading institutions provide student-facing dashboards with plain-language explanations of what the model saw. Explanation layers such as SHAP values and counterfactual summaries are now standard with major vendors. Students should also see what action would reduce their score, framed around realistic steps. Transparency builds trust and reduces complaints when the model occasionally produces an unexpected flag.
Vendor platforms range from roughly 10 to 60 dollars per student per year on average. Pricing varies with scale, included advisor services, data integration complexity, and feature breadth. In-house builds can be cheaper per student at scale but demand ongoing data engineering staff. Institutions should model full three-year cost before committing to any specific vendor contract.
Measurable retention lift typically appears in the second full academic year after deployment ends. The first year goes to integration, advisor training, change management, and model calibration work. Early wins are usually visible in course-level DFW rates before term-over-term retention moves significantly. Institutions that invest in change management alongside the model see faster adoption and faster results overall.
Over-reliance appears when teachers treat the score as a verdict rather than a prompt for conversation. Role-specific explanations and clear override paths keep the human in the loop appropriately. Training programs that emphasize interpretation rather than automation reduce the risk of advisor burnout. Institutions should audit for cases where a student was penalized by the score without any human review.
Generative models currently complement, rather than replace, classical risk scoring in most educational platforms. A gradient boosted tree still produces the calibrated score, and a language model writes the outreach message. This layered design preserves auditability while enabling flexible, personalized communication at scale. Pure generative tutoring without an underlying predictor remains hard to govern under current audit frameworks.
Prediction forecasts outcomes such as grades, course withdrawal, or multi-term graduation across every active learner. Adaptive learning responds dynamically to a learner by adjusting content, pacing, and practice problems. Prediction tends to drive advisor outreach, while adaptive learning tends to drive content routing inside a course. Many institutions combine both tools, with prediction informing adaptive paths at the module level.
Request pre-registered methodology, published fairness audits, and quarterly performance reports from every vendor under review. Pressure-test outcome claims with the campus institutional research office before signing any contract. Ask for comparison cohorts, propensity matching details, and intention-to-treat framing in all shared impact reports. Vendors that resist methodological scrutiny rarely survive the first external audit after deployment goes live.
States are passing education data protection laws that layer onto FERPA with stronger provisions. California AB 1584 and New York Education Law 2-d set baseline requirements for K-12 vendor contracts. Washington state has advanced student data privacy legislation that mirrors some elements of the General Data Protection Regulation. Institutions should track state-level activity annually because new rules can arrive mid-year during legislative sessions.