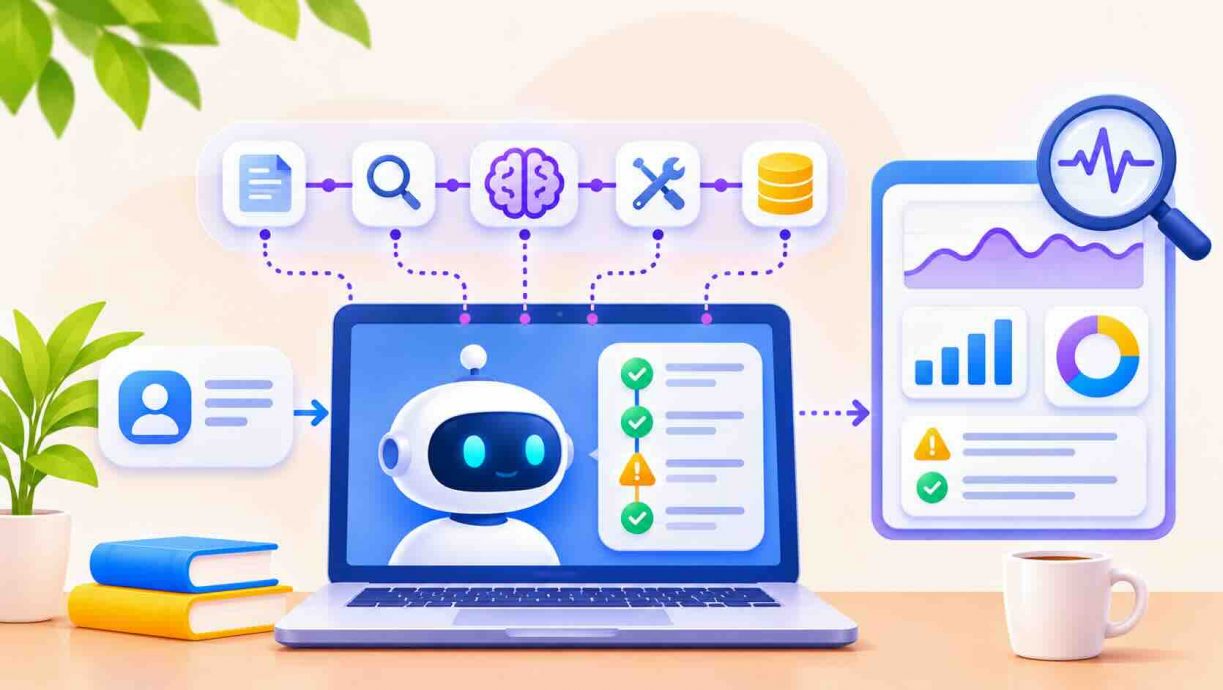

Introduction
What is AI observability and tracing for LLM applications, and why are so many engineering teams investing in it right now? Language model applications behave like probabilistic pipelines, so the same input can produce different outputs, costs, and failure modes from one request to the next. Observability gives teams the ability to inspect what happened inside a request after the fact, using traces, metrics, logs, and evaluation scores. The LangChain State of Agent Engineering report found that 89% of surveyed organizations have implemented some form of observability for their agents, and 62% have detailed tracing. That adoption curve shows that watching an AI system is no longer optional once real users and real money are involved. This guide explains the vocabulary, the data model, the standards, the tools, the risks, and the habits that make tracing genuinely useful. By the end you will know how to decide what to capture, how to read a trace, and how to turn production behavior into better prompts, retrieval, and agents.
Quick Answers on AI Observability and LLM Tracing
What is AI observability and tracing for LLM applications?
AI observability is the practice of recording each prompt, retrieval, model call, and tool step as linked spans, so teams can debug quality, cost, and latency.
How is LLM tracing different from the normal application monitoring that engineering teams already run?
Normal monitoring tracks uptime and errors, while LLM tracing also captures prompts, context, token counts, and output quality, because a fast response can still be wrong.
What should a trace of a single LLM request contain so that engineers can debug it later?
A useful LLM trace holds the user input, prompt version, retrieved documents, model name, token usage, step latency, tool calls, final output, and evaluation scores.
Key Takeaways for AI Observability and Tracing
- LLM observability extends classic monitoring with prompts, retrieved context, token usage, and quality scores, because a fast and error-free response can still be incorrect.
- A trace is a tree of spans that records each retrieval, model call, and tool step, which lets engineers replay exactly how an answer was produced.
- OpenTelemetry semantic conventions and OpenInference are making AI telemetry portable, so teams can switch backends without rewriting every instrumentation call.
- Good practice pairs tracing with evaluation, cost tracking, and privacy controls, because trace data is only valuable when it is searchable, scored, and safely retained.
Table of contents
- Introduction
- Quick Answers on AI Observability and LLM Tracing
- Key Takeaways for AI Observability and Tracing
- What Is AI Observability and Tracing in Practice
- Why Traditional Monitoring Falls Short for Language Model Applications
- The Core Building Blocks of LLM Tracing: Traces, Spans, and Sessions
- How a Single Request Becomes a Trace in a Retrieval Pipeline
- Beyond Traces: What Is Worth Capturing in the Wider Signal Set
- How OpenTelemetry and Semantic Conventions Standardize AI Telemetry
- Choosing Between Open Source and Commercial Tracing Platforms
- Implementation Steps for Instrumenting an LLM Application
- Tracking Cost, Latency, and Token Usage in Production
- Debugging Hallucinations and Retrieval Failures with Traces
- Tracing Agents, Tool Calls, and Multi-Step Workflows
- Evaluation Loops: Turning Traces into Test Data
- Security, Privacy, and Data Retention Risks in Trace Data
- Ethics, Accountability, and Auditability of AI Telemetry
- Organizational Practices: Who Owns AI Observability
- The Future of AI Observability and Tracing: What Is Coming Next
- Key Insights on AI Observability and LLM Tracing
- How Teams Use Tracing to Ship Better AI Products
- Case Studies in Production: How Three Organizations Learned from Their Traces
- Frequently Asked Questions on AI Observability and Tracing for LLM Applications
What Is AI Observability and Tracing in Practice
What is AI observability and tracing for LLM applications today? It is the discipline of capturing prompts, retrievals, model calls, tool steps, costs, and evaluation scores as connected traces, so engineers can debug nondeterministic behavior.
An Interactive From AIplusInfo
How Many Spans Will Your LLM App Emit?
Pick a pipeline shape, set your traffic, and see how fast tracing volume approaches free-tier limits.
Retrieval question answering
10,000
100%
Spans per month
0
Requests x 30 days x spans per request x share traced.
Datadog free tier (40,000 spans)
0%
LangSmith developer plan (5,000 traces)
0%
Spans per request (3, 8, 25) are planning assumptions for illustration, not measurements. Free-tier limits come from Datadog and LangChain. Vendor plans change, so confirm current limits.
Why Traditional Monitoring Falls Short for Language Model Applications
Building on that definition, it helps to see why the monitoring tools that served web services for two decades leave large blind spots in language model systems. Classic application performance monitoring answers questions about uptime, error rates, CPU load, and request latency, which are all measurable with a status code and a timer. A language model endpoint can return a clean success response in under a second and still deliver an answer that is fabricated, off-policy, or simply useless to the user. The failure lives in the content of the output rather than in the health of the infrastructure, so a green dashboard can hide a product that is quietly getting worse. Engineers who rely only on infrastructure metrics often learn about quality regressions from frustrated support tickets instead of from their own alerts. This gap is the first reason teams adopt purpose-built observability for AI.
Nondeterminism adds a second layer of difficulty that conventional tools were never designed to handle. The same prompt sent twice can yield different completions because sampling parameters such as temperature introduce controlled randomness into every response. A bug report that says the assistant gave a wrong answer yesterday is nearly impossible to reproduce unless the exact prompt, context, and model version were saved. Teams that skip this record end up guessing at causes, and guessing is expensive when each retry also costs tokens. Observability turns a vague complaint into a stored, inspectable artifact that an engineer can open, read, and replay. The article on reducing LLM hallucinations in production shows how often the root cause turns out to be a retrieval or prompt problem rather than a model problem.
A third gap is the sheer number of moving parts in a modern application. A single user question may trigger query rewriting, a vector search, a reranker, one or more model calls, a tool invocation, and a final formatting step. Each stage can fail silently, and each stage adds latency and cost that a single end-to-end timer cannot divide fairly. Without step-level visibility the team cannot tell whether a slow answer came from a congested vector database or from an unusually long generation. Distributed tracing, borrowed from microservice engineering, solves this by giving every step its own timed record linked to the same request. The AI-specific twist is that each record also carries the content, token counts, and quality signals that explain what the step actually did.
The Core Building Blocks of LLM Tracing: Traces, Spans, and Sessions
Moving on to the vocabulary, every tracing system for language models rests on a small set of shared concepts. A trace represents one complete unit of work, such as a single user request moving through your application from the first byte received to the final response sent. Inside that trace sits a tree of spans, where each span records one operation with a start time, an end time, a status, and a bag of attributes. A retrieval call, a model call, a tool call, and a post-processing function would each become a separate span, nested under the span that triggered them. The parent and child relationships between spans are what let an engineer see causality instead of a flat list of log lines. The nesting also makes it easy to roll up latency and cost from the leaves to the root.
Attributes are the key and value pairs that make an AI span useful rather than merely timed. For a model call they usually include the model name, the provider, the temperature, the input token count, the output token count, and the finish reason. For a retrieval span they include the query text, the number of documents returned, and often the identifiers and similarity scores of those documents. The OpenInference project, which is complementary to OpenTelemetry, defines conventions for describing LLM invocations along with surrounding context such as vector store retrieval and external tool use. Teams that follow a shared attribute vocabulary can move between visualization tools without redoing their instrumentation. Consistent naming also makes dashboards and alert rules far easier to write and share across projects.
Sessions and threads group many traces that belong to one conversation or one user journey. A chat assistant, for example, produces a new trace for every turn, yet the product question is usually about the whole conversation and where the user got stuck. Grouping those traces under a session identifier allows a reviewer to read the dialogue top to bottom and see how earlier turns shaped later failures. Session views also support useful aggregate metrics such as turns per resolved issue and abandonment points. User identifiers, tags, and release versions can be attached as metadata so that traces can be filtered by customer segment, feature flag, or deployment. This metadata layer is cheap to add at the start and painful to retrofit once volume has grown.
Events and scores complete the data model that every tracing tool shares. An event is a point-in-time annotation attached to a span, such as a guardrail triggering, a cache hit, or a retry being scheduled. A score is a numeric or categorical judgment attached to a trace or span, produced by a human reviewer, a heuristic, or another model acting as a judge. Scores matter because they convert qualitative behavior into something that can be graphed, alerted on, and compared across releases. When a team can say that the helpfulness score on a given prompt version dropped four points after a deployment, a rollback decision becomes straightforward. Without scores, the same conversation devolves into subjective debate about a handful of cherry-picked examples.
How a Single Request Becomes a Trace in a Retrieval Pipeline
Stepping back from definitions, a concrete walk through one request makes the abstract model easier to hold in mind. Imagine a support assistant that answers questions from a company knowledge base using a retrieval augmented generation pipeline. The user asks how to reset a billing address, and the application opens a root span named after the request, with the user question stored as its input. Beneath it, a rewrite span records the reformulated search query, a retrieval span records the top documents and scores, and a generation span records the assembled prompt. When the answer is wrong, the trace shows at a glance whether the right document was ever retrieved. A reviewer can then decide whether to fix the chunking, the embedding model, the prompt, or the generation settings.
The same trace also exposes where the time and money went. Suppose the whole request took four seconds, and the trace shows retrieval used 300 milliseconds while generation consumed three and a half seconds. The fix is then obvious: shorten the context, switch to a faster model for simple questions, or stream the answer so the user sees progress sooner. Anyone building such a pipeline can compare notes with the guide to building a RAG chatbot with open source tools, which covers each component. Seeing each component as a timed, scored span changes how teams prioritize optimization work.
Beyond Traces: What Is Worth Capturing in the Wider Signal Set
Beyond traces, a mature practice combines several kinds of telemetry that answer different questions. Metrics are aggregated numbers over time, such as requests per minute, median latency, token spend per hour, and error rate by model. They are cheap to store and ideal for dashboards and alerts, but they cannot explain why a particular request went wrong. Logs are timestamped text records that capture discrete events and errors, and they remain useful for infrastructure problems that sit outside the model call. Traces tie the other signals together by providing the request context in which a metric spike or a log line occurred. The three classic signals still apply to AI, and the new ingredient is the quality signal that sits beside them.
Quality signals come from evaluations, which are automated or human checks run against real or sampled outputs. Common techniques include rule-based checks for format and policy violations, similarity checks against reference answers, and model-graded rubrics for tone, faithfulness, and helpfulness. The guide to evaluating LLM outputs with a judge model explains how to design such rubrics and where they tend to mislead. In the LangChain survey, 52.4% of respondents run offline evaluations on test sets, while 37.3% run online evaluations against live traffic. Human review is used by 59.8% of respondents and model-based judging by 53.3%, which shows that most teams blend both approaches. Attaching these scores to traces closes the loop between what the system did and how well it did it.
User feedback is the third source of quality data and often the most honest one. Thumbs up and thumbs down buttons, edits to a drafted reply, and follow-up questions that repeat the original query all indicate whether an answer helped. Capturing that feedback as a score on the originating trace lets a team sort failures by how much users actually cared. It also protects against a common trap, where offline evaluation sets drift away from the questions real customers ask. A weekly review of the lowest-scoring production traces is one of the cheapest and most effective habits an AI team can adopt.
How OpenTelemetry and Semantic Conventions Standardize AI Telemetry
Turning to standards, OpenTelemetry has become the common language for traces, metrics, and logs across modern software. Its generative AI semantic conventions define a shared schema for describing model calls, token usage, agent steps, and provider details. According to Datadog's overview of the conventions, the schema covers prompts, model responses, token usage, tool and agent calls, and provider metadata. Attribute names such as the requested model, the provider name, the operation name, and input token counts give every vendor the same vocabulary. The specification itself now lives in a dedicated GenAI semantic conventions repository, which signals how quickly this area is evolving. Teams should treat attribute names as stable enough to adopt but watch release notes for changes.
The practical benefit of standards is portability and reduced lock-in. If your application emits spans using shared conventions, you can send them to an open source viewer during development and a commercial platform in production. Datadog states that it supports the conventions from version 1.37 onward, and the Thoughtworks Technology Radar notes that both the Python and TypeScript SDKs of Langfuse are built on OpenTelemetry. Instrumenting once against an open standard is the cheapest insurance against a future tooling migration. Standards also let auto-instrumentation libraries capture calls to popular model providers and frameworks without manual code in every function. The remaining manual work focuses on business context, such as tenant identifiers, prompt versions, and feature names.
Standards still have rough edges that practitioners should plan around. Conventions for agents, tool calls, and multi-step workflows are newer and less settled than those for single model calls. Some backends ingest standard attributes faithfully, while others map them to proprietary fields that lose detail. Content capture is a particular concern, because storing full prompts and completions has privacy consequences that the conventions leave to the implementer. A short internal document that records which attributes you emit, which you redact, and which backend you target will save hours of confusion later.
Choosing Between Open Source and Commercial Tracing Platforms
Choosing among the available platforms starts with clarifying what your team actually needs rather than comparing feature matrices. Open source options such as Langfuse and Arize Phoenix can be self-hosted, which appeals to teams with strict data residency rules or a preference for owning their stack. Commercial platforms such as LangSmith and Datadog offer managed infrastructure, enterprise support, and deep integration with existing monitoring workflows. The Thoughtworks Radar entry on Langfuse notes that its newer architecture adds ClickHouse, Redis, and S3, which improves scalability but makes self-hosting more complex. The right choice depends less on feature counts than on who will operate the system and where sensitive data may legally live. Evaluate each candidate against a realistic week of your own traffic before committing.
Pricing and limits deserve a close read because trace volume grows faster than most teams expect. Vendor pages describe free tiers with modest quotas, and one LangSmith comparison page lists a developer plan with one seat and 5,000 traces per month. Datadog's documentation says its agent observability is free for customers submitting up to 40,000 LLM spans per month. Spans multiply quickly in agent workflows, so a single user action can consume dozens of billable units. Sampling strategies, retention windows, and payload truncation are the main levers for keeping costs predictable. Treat vendor-authored comparisons as starting points and verify every claim in a proof of concept.
Implementation Steps for Instrumenting an LLM Application
Moving on to implementation, the safest path is to instrument in layers and verify each layer before adding the next. Begin by choosing a tracing backend and a naming convention for services, environments, and release versions, because retrofitting names later breaks historical comparisons. Next, enable automatic instrumentation for your model provider SDK and orchestration framework, which gives you basic model call spans with token counts almost immediately. Run a handful of real requests and open the resulting traces to confirm that inputs, outputs, and timings look correct. Every instrumentation change should be validated by reading real traces, not by trusting that the exporter is silently working. Only after this baseline is solid should you add custom spans and metadata.
The second layer adds the business context that automatic tools cannot guess. Wrap your retrieval function, reranker, and any tool-calling code in explicit spans so that each shows its own latency and inputs. Attach identifiers for the user, session, tenant, feature, and prompt version, taking care to hash or omit anything that counts as personal data. Record the prompt template name and version as an attribute, since that single field answers most questions about why behavior changed. Store the model parameters used for each call so that an engineer can reproduce a result later. These additions are small in code but enormous in debugging value.
The third layer of instrumentation attaches evaluation scores and user feedback to each trace. Start by sampling a percentage of production traces and scoring them with a lightweight judge prompt or a set of rule-based checks. Add user feedback events and map them back to the originating trace identifier. Create alerts on score drops, cost spikes, and latency percentiles rather than on raw error counts alone. Review the alert thresholds after two weeks of data, because early guesses are usually too tight or too loose. The guide on how to measure AI agent performance offers metrics that fit this layer well.
The final layer of the rollout is governance of the telemetry data itself. Decide how long raw prompts and outputs are retained, who can view them, and which fields are masked before storage. Document the sampling rate so that analysts do not misread dashboards built on partial data. Add a lightweight review step to your release checklist that compares trace-based metrics before and after each prompt or model change. Over time this routine becomes the backbone of a disciplined release process for AI features.
Tracking Cost, Latency, and Token Usage in Production
Next, the financial side of observability deserves its own attention, because token bills behave differently from the fixed costs of traditional servers. Every model call consumes input tokens for the prompt and output tokens for the completion, and prices differ by model, provider, and sometimes by context length. A trace that records token counts on each span lets you compute the cost of a single request by multiplying usage by the current price. Summing those figures by feature, tenant, or prompt version reveals which parts of the product are expensive and which are cheap. Cost per successful task is a far more honest metric than cost per request, because retries and failed attempts still burn tokens. The article on measuring agent cost per task walks through that calculation for multi-step workflows.
Latency tracking needs the same step-level granularity as cost tracking does, for reasons that are easy to see. Users experience the total delay, yet engineers can only reduce it by finding which span dominates the critical path. Time to first token matters for streaming interfaces, while total generation time matters for batch jobs and downstream automations. Percentile latencies such as the 95th and 99th reveal tail behavior that averages hide, and tails are where frustrated users live. Traces also show whether sequential calls could run in parallel, a change that often cuts wall-clock time without touching the model. Alerts on percentile latency by endpoint usually catch provider slowdowns before customers report them.
Finally, cost and latency data feed the optimization decisions that every team eventually has to make. Prompt caching, shorter contexts, smaller models for easy queries, and response caching all reduce spend, and traces show where each tactic will pay off. The guide to reducing LLM inference costs describes these levers in depth. Without trace data, optimization becomes guesswork driven by anecdotes about the most visible expensive request. With it, a team can rank opportunities by monthly savings and test each change against quality scores before rolling it out. Cost observability and quality observability should always be read together, since a cheaper answer that is wrong saves nothing.
Debugging Hallucinations and Retrieval Failures with Traces
Turning to debugging, the most valuable use of a trace is diagnosing a bad answer by walking backward through the pipeline. The first question is whether the model had access to the facts needed to answer correctly. If the retrieval span shows that the relevant document never appeared in the results, the fault lies with chunking, embeddings, query rewriting, or the index itself. If the document was retrieved but ignored, the problem is more likely the prompt structure, the context ordering, or the model's tendency to prefer its own priors. Separating retrieval failures from generation failures is the single most useful diagnostic move in any retrieval based application. The Thoughtworks Radar makes the same point, noting that low-scoring traces help show whether the pre-retrieval, retrieval, or generation stage needs work.
Hallucination analysis benefits from traces in a second way, because they preserve the exact context the model saw. A claim that appears nowhere in the retrieved passages is a strong signal of unsupported generation. Automated groundedness checks can compare each sentence of the output against the stored context and flag mismatches for review. The overview of LLM hallucination detection techniques covers several approaches that can be attached to traces as scores. Over time a library of confirmed failure traces becomes a regression suite that every new prompt or model must pass.
Tracing Agents, Tool Calls, and Multi-Step Workflows
Looking at agents, tracing becomes both more important and more difficult than it is for single prompt applications. An agent decides at runtime which tool to call, how to interpret the result, and whether to loop again, so the path through the code differs on every run. A trace for an agent therefore records a sequence of reasoning steps, tool invocations, and observations rather than a fixed pipeline. The OpenTelemetry conventions reflect this by describing operations such as agent runs and tool calls alongside ordinary model calls. An agent trace is effectively the agent's diary, and reading it is the fastest way to understand why it chose a particular action. Teams that skip this step find agent bugs almost impossible to reproduce.
Tool calls deserve careful capture because they are where agents touch the outside world. Each tool span should record the tool name, the arguments the model supplied, the raw result, the duration, and any error. The explainer on function calling in LLMs shows how those arguments are generated, which helps explain malformed calls that appear in traces. Argument validation failures, repeated identical calls, and runaway loops all show up clearly when spans are nested under the agent run. Setting a maximum step count and logging when it is reached prevents silent infinite loops from draining budgets.
Context handling is the third area where agent traces pay off. Long running agents accumulate messages, tool outputs, and memory, and the prompt assembled at each step can grow until quality degrades or costs spike. Recording the size of the context at each model call makes this growth visible. The guide to context engineering for LLM agents explains how to manage that growth deliberately. When traces show context size climbing steadily while success rates fall, the team has direct evidence for introducing summarization or pruning.
Evaluation Loops: Turning Traces into Test Data
Building on debugging, the next step is converting production traces into durable test assets. A trace that captured a real failure is a better test case than any invented example, because it reflects the messy phrasing and context real users supply. Teams curate such traces into datasets, attach expected behaviors, and run candidate prompts or models against them before deployment. The Thoughtworks Radar observes that captured traces can serve as test data before changes ship. A dataset grown from real traces keeps offline evaluation honest and anchored to what customers actually ask. Without this loop, test suites drift toward easy questions and stop catching regressions.
Online evaluation complements the offline suite by scoring live traffic. A sampled percentage of production traces is passed through automated checks, and scores are written back to the originating trace. Dashboards then show quality trends by prompt version, model, and customer segment. For agent systems, the walkthrough on evaluating Bedrock agents with Ragas shows how metric libraries can score multi-step runs. In the LangChain survey, the share of respondents with agents in production who report no evaluation fell from 29.5% to 22.8%, a sign that this loop is becoming standard. Teams still need human review for ambiguous cases, since automated judges share blind spots with the models they grade.
Security, Privacy, and Data Retention Risks in Trace Data
Shifting to risk, trace data is itself a sensitive asset that needs the same care as any production database. Prompts and completions often contain customer names, account details, health information, or confidential business documents. Storing them in a third-party observability platform creates a copy of that data outside your primary controls. Regulations such as the GDPR and sector rules in finance and healthcare may restrict where such data can live and how long it can be kept. Capturing everything by default is convenient for debugging and dangerous for compliance, so capture rules must be deliberate. A data protection review should precede any rollout that stores full payloads.
Practical mitigations for these risks start with redaction and data minimization at the application layer. Mask emails, phone numbers, identifiers, and secrets before spans leave the application, and store hashes where only equality matters. Use role-based access so that only a small group can read raw payloads, and log every access. Set retention windows that match your legal obligations, and prefer short windows for raw text with longer windows for aggregated metrics. For regulated workloads, self-hosting an open source backend inside your own network boundary is often the simplest way to meet residency rules. These controls cost little to build early and a great deal to add after an audit finding.
Traces can also reveal attacks, which makes them a security tool as well as a security risk. Prompt injection attempts leave visible fingerprints, such as instructions embedded in retrieved documents or tool outputs that try to redirect the agent. The primer on prompt injection attacks and defenses describes these patterns. Alerts on unusual tool arguments, unexpected domains, or sudden spikes in refusals can catch exploitation early. Pair these alerts with deterministic guardrails for AI agents so that detection and prevention reinforce each other.
Ethics, Accountability, and Auditability of AI Telemetry
Beyond the engineering concerns, observability raises ethical questions about transparency, accountability, and the treatment of the people whose data fills the traces. Auditors and regulators increasingly expect organizations to explain how an automated decision was reached, and a stored trace is among the strongest records available. It shows what input the system received, what context it retrieved, what the model produced, and which safeguards ran. Telemetry that can reconstruct a decision turns accountability from a promise into evidence. That evidence protects users who were harmed by an error, and it protects organizations that acted responsibly.
The same capability can be misused if it is applied without restraint. Recording employee interactions with internal assistants can drift into surveillance, and logging user conversations without clear notice undermines trust. Organizations should publish plain language policies describing what is captured, why, who may view it, and how long it is kept. Review boards such as those described in the guide to enterprise agent governance with Agent 365 can set the boundaries. Purpose limitation, meaning data collected for debugging is not repurposed for performance reviews, is a sound principle to adopt. Ethical observability asks not only what can be measured but what should be.
Organizational Practices: Who Owns AI Observability
Moving on to people and process, tools alone never deliver reliable AI systems; ownership and routines do. In many companies, observability for AI sits awkwardly between platform engineering, data science, and product teams, and each assumes someone else is watching. A clear owner for the telemetry pipeline, a named reviewer for quality dashboards, and an escalation path for incidents remove that ambiguity. Small teams can combine these roles in one person, while larger organizations often create an AI reliability function. Naming an owner for quality signals matters as much as choosing a tracing vendor. The roles should be written down and revisited each quarter.
Routines are what make the collected data genuinely useful to the people who need it. A weekly review of the worst production traces, a monthly review of cost trends, and a release checklist comparing evaluation scores before and after each change form a practical cadence. Incident postmortems should link directly to the traces involved, so lessons become test cases rather than folklore. Product managers benefit from seeing the same dashboards, since they translate quality scores into user impact. Cross-functional attendance in these reviews reduces the handoff delays that plague AI projects.
Financial discipline joins the picture once usage grows beyond a single experimental prototype. Finance teams want to forecast spend, and engineering wants to know which features justify their token costs. The discussion of FinOps for agentic AI describes how to allocate and govern those costs with tagged telemetry. Showback reports that attribute spend to teams and features create healthy incentives to optimize. Tagging every span with a feature and tenant at the start makes this possible without later rework.
Training and shared literacy close the loop between tooling and everyday engineering practice. New engineers should learn to read a trace as part of onboarding, the way earlier generations learned to read a stack trace. Shared playbooks that map symptoms to likely causes, such as slow answers pointing to context size or wrong answers pointing to retrieval, accelerate diagnosis. Support staff who can open a trace and see what happened resolve customer complaints faster and escalate more precisely. Over time this shared literacy becomes a competitive advantage, so teams asking what is AI observability and tracing for LLM applications should budget for training.
The Future of AI Observability and Tracing: What Is Coming Next
Looking ahead, observability for AI is moving from an optional add-on toward a baseline requirement of production systems. The LangChain survey calls observability table stakes for agents, and its numbers show that most organizations with agents in production already trace them. The New Relic 2026 Observability Forecast found that 22% of financial firms run AI agents with no monitoring. The same report expects AI monitoring to reach 83% in that sector within twelve months. The gap between adoption and oversight is closing quickly, and the teams that close it first will ship with more confidence. Regulatory pressure and rising customer expectations will accelerate this trend across most industries.
On the technical side, expect much tighter integration between tracing and evaluation. Instead of treating scores as an afterthought, platforms will run judges automatically on sampled traces and surface regressions as alerts. Standards will mature as the OpenTelemetry GenAI conventions stabilize and more vendors converge on shared attribute names. Agent specific telemetry, covering plans, memory reads, and delegation between agents, will become more detailed. Cost attribution will grow more granular as pricing models evolve toward per task and outcome based schemes.
On the cultural side, observability will shift from firefighting toward continuous improvement. Teams will treat every production trace as potential training signal for prompts, retrieval settings, and eventually fine-tuned models, subject to privacy limits. Privacy preserving techniques such as on-premises backends, redaction pipelines, and synthetic replay will expand to make that practice safe. Developers who learn tracing fundamentals today will find that skill transfers across every new framework and model generation. Anyone still asking what is AI observability and tracing for LLM applications will find that the tools change while the habit of inspecting real behavior endures.
Chart From AIplusInfo
How Far Observability Has Spread Among Agent Builders
Share of surveyed organizations, in percent. Chart type: horizontal bar, because the data compares categories at one point in time.
Source: LangChain, State of Agent Engineering, a survey of 1,340 responses collected November 18 to December 2, 2025.
Key Insights on AI Observability and LLM Tracing
- A LangChain survey of 1,340 practitioners found that 89% of organizations have implemented some form of observability for their agents, and 62% have detailed step-level tracing.
- Among respondents with agents in production, 94% report some observability and 71.5% report full tracing in the State of Agent Engineering findings, so tracing grows with maturity.
- The same survey shows that only 37.3% of organizations run online evaluations against live traffic, so most teams still score quality offline rather than where users experience it.
- New Relic's 2026 financial services forecast reports that 22% of firms run AI agents in production with no monitoring, which leaves a large share of deployed agents effectively unobserved.
- The same New Relic report puts the mean cost of a high-impact outage in financial services at US$1.69 million per hour, so slow detection carries real financial exposure.
- Datadog says its agent observability tier is free for up to 40,000 LLM spans per month, which gives small teams room to trace production traffic before paying.
- LangChain reports that Podium raised its conversation-end F1 score from 91.7% to 98.6% and cut engineering intervention by 90%, an example of traces and evaluations driving measurable improvement.
Taken together, these figures describe an industry that has accepted tracing as a baseline but has not yet finished building the evaluation and monitoring habits around it. Adoption of basic observability is high, while online evaluation and complete monitoring of production agents lag behind. The financial exposure from slow incident detection explains why regulated sectors are pushing hardest on oversight. Free tiers and open standards lower the barrier, so cost is no longer a credible reason to run agents blind. The strongest outcomes in the available case material come from teams that connected traces to datasets and evaluations rather than viewing traces alone. The practical lesson is to treat tracing as the foundation and evaluation as the structure built on top of it.
| Dimension | Traditional application monitoring | LLM observability and tracing |
|---|---|---|
| Primary unit of work | HTTP request or database query | Trace of prompts, retrievals, model calls, and tool steps |
| Failure signal | Error codes, timeouts, crashes | Low quality scores, ungrounded answers, policy violations |
| Reproducibility | Deterministic given the same input | Nondeterministic, so exact context must be stored |
| Cost model | Mostly fixed infrastructure spend | Variable token spend per request and per step |
| Quality assessment | Not part of the tooling | Human review, rule checks, and model graded scores |
| Data sensitivity | Metadata and error messages | Full prompts and outputs that may hold personal data |
| Standards | Mature OpenTelemetry signals | Emerging GenAI semantic conventions and OpenInference |
| Typical owner | Platform or site reliability team | Shared between AI engineering, data, and product teams |
How Teams Use Tracing to Ship Better AI Products
Replit Agent and Searchable Long Traces
Replit deployed LangSmith tracing for Replit Agent, a system that plans work, creates development environments, installs dependencies, and deploys applications for more than 30 million developers. Its traces grew to hundreds of steps, which made them slow to load and tedious to read. The LangChain and Replit teams built faster large-trace ingestion, search inside a trace by keywords in inputs or outputs, and a thread view that groups traces from one conversation. According to the published Replit customer story, in-trace search produced a substantial reduction in the time engineers needed to debug agent steps. The story gives no figures for load times or debugging hours, so the size of the gain cannot be verified. It was also written by the vendor, which is a limitation when weighing the claims.
Mava and Langfuse for Support Bot Quality
Mava, an AI-first customer support platform, adopted Langfuse to gain visibility into the outputs of the OpenAI models it used. The team applied the tool in 3 areas: scoring output quality across prompt changes, tracing requests to find error causes, and analyzing cost, usage, and latency in more detail. A co-founder wrote in the Mava case study on the Langfuse site that the tool became indispensable within days and saved the development team a lot of time. The account is a testimonial without published numbers for quality gains, cost reductions, or latency improvements. It also does not discuss setup effort or trade-offs, which a reader would want before copying the approach. Still, the three-part usage pattern of scoring, tracing, and analytics matches how many teams begin.
Datadog and the OpenTelemetry GenAI Conventions
Datadog implemented support for the OpenTelemetry GenAI semantic conventions from version 1.37 onward, so applications that emit standard spans can appear in its agent observability views without custom mapping. The conventions describe prompts, responses, token usage, tool calls, and provider metadata, and Datadog derives latency and cost from span duration and provider details. According to the Datadog engineering post, the tier is free for customers submitting up to 40,000 LLM spans per month, with a 14 day trial for new users. For teams that already emit standard spans, this means a reduction in custom instrumentation work when they change backends. The post is vendor material, and it does not publish adoption figures or describe attributes that remain unsupported. Convention details are still evolving, which is a drawback for teams that need a stable contract today.
Recommended by AIplusInfo
Books to go deeper on tracing and AI engineering
Two well-regarded titles that map to the practices described above.
As an Amazon Associate, AIplusInfo earns from qualifying purchases.

Book
AI Engineering: Building Applications with Foundation Models
Covers evaluation, deployment, and user feedback loops for foundation model applications, the practices that tracing data supports.
Buy on Amazon
Book
Observability Engineering: Achieving Production Excellence
Explains traces, structured events, and debugging unknown failures in production, the ideas that LLM tracing extends to prompts and models.
Buy on AmazonCase Studies in Production: How Three Organizations Learned from Their Traces
Case Study: Podium Cuts Engineering Intervention with LangSmith
Podium's AI Employee answers customer inquiries for small businesses, and its engineers faced a problem with conversation endings, because the agent produced awkward repeated goodbyes. Each interaction involved 20 to 30 model calls, which made it hard to trace how any single inquiry had been handled. Troubleshooting usually meant engineers reviewing inputs and outputs and then rewriting code, a slow loop for a behavior that looked trivial to customers. Customers noticed the awkward goodbyes immediately, yet no infrastructure alert ever fired. The team needed a way to see every call, group similar failures, and test fixes against realistic conversations before shipping them. This was a classic case where an error was invisible in infrastructure metrics but obvious in the content of the conversation.
Podium adopted LangSmith for tracing, dataset curation, and evaluation, and built a dataset of conversation scenarios that included different ways a chat can end. It enriched traces with metadata such as customer profiles and business types to keep the dataset balanced. It then distilled a smaller model from a larger one and compared both with pairwise evaluations. According to the LangChain case study, the F1 score for detecting conversation end rose from 91.7% to 98.6%, and engineering intervention for troubleshooting fell by 90%. Support specialists were also given access to traces and the playground so they could diagnose issues without engineers. The results are self-reported by the vendor and cover only one behavior. Application bugs and model errors still require engineering time, which limits how far the 90% figure generalizes.
Case Study: Klarna Uses Step-by-Step Traces for Its AI Assistant
Klarna, which serves 85 million active users, faced growing escalations across several departments, with customer expectations and global scale demanding faster and more accurate support. The company needed an assistant that could route each request to the right task handler, keep prompts specific to each scenario, and be tested before every change. Without step-by-step visibility, engineers would struggle to locate where a conversation went wrong across a multi-agent system. Rejections and refunds were particularly hard to diagnose, since the root cause could sit in routing, retrieval, or generation. Every unresolved case also escalated to a human agent, which raised cost and slowed customers further.
Klarna built its assistant on LangGraph as a multi-agent system with controlled routing and scenario-specific prompts, and used LangSmith traces to see how the agent behaved at each step. The team followed test-driven development, refining critical use cases through evaluations and prompt iteration. In the LangChain account of the deployment, Klarna reports an 80% reduction in average query resolution time, about 70% of repetitive support tasks automated, and 2.5 million conversations handled. The same page equates this to the work of 700 full-time staff. These numbers are self-reported by a vendor, so they deserve caution and limit what outsiders can conclude. No baseline or measurement period is given for the 80% figure. Gains in latency and cost are not quantified, and the page does not address failure cases or customer satisfaction.
Case Study: Financial Services Firms and the Unmonitored Agent Gap
The New Relic and Enterprise Technology Research study of 278 financial services respondents, drawn from a global sample of 2,575, identified a clear problem. The finding was that 22% of financial services companies run AI agents in production with no monitoring. Only 42% of financial firms currently monitor AI applications, compared with 47% globally, and 38% monitor agentic systems, versus 44% globally. At the same time, 78% of financial services leaders say AI-generated code makes reliable observability more critical. The mean cost of a high-impact outage in the sector reaches US$1.69 million per hour. Detection takes 35 minutes on average, and resolution takes a further 49 minutes. Firms that cannot see inside their AI systems face a challenge in meeting those numbers.
The solution the report points toward is rapid adoption of monitoring, with respondents expecting AI monitoring to reach 83% and agentic monitoring 75% in financial services within twelve months. The published findings from New Relic frame compliance and AI governance as the main drivers of that demand. Faster detection is a measurable target here, since each minute shaved from detection time reduces exposure at a cost of roughly US$28,000 per minute on average. The study is a vendor commissioned survey, and its projections are stated intentions rather than outcomes. It does not show which monitoring approaches actually reduced outage cost, which is a significant limitation.
Frequently Asked Questions on AI Observability and Tracing for LLM Applications
AI observability is the practice of understanding what happens inside a language model application by recording prompts, retrievals, model calls, tool steps, and quality scores. Tracing is the part that links those records into a tree for each request. Together they let engineers explain why a particular answer was produced. Teams use them to debug failures, control cost, and improve prompts and retrieval over time.
Regular monitoring focuses on infrastructure health, such as uptime, error rates, and latency. LLM observability adds the content of each step, including prompts, retrieved documents, token usage, and output quality. A language model call can return successfully and still be wrong, so quality signals are essential. Both approaches are useful, and most teams run them side by side.
A span is a timed record of one operation, such as a retrieval, a model call, or a tool invocation. It carries a start time, an end time, a status, and attributes like model name and token counts. Spans nest under parent spans to form a trace for the whole request. This nesting shows which step caused delay, cost, or error.
You do not strictly need it, since several platforms offer their own SDKs. OpenTelemetry is attractive because its GenAI semantic conventions give a shared vocabulary for model calls, tokens, and agent steps. Using it reduces lock-in and lets you change backends without rewriting instrumentation. Many popular tools already build on it or accept its data.
Open source options include Langfuse and Arize Phoenix, and commercial options include LangSmith and Datadog. Each supports traces, evaluations, and dashboards with different strengths in hosting, pricing, and integrations. Choose based on who will operate it, where data may be stored, and which frameworks you use. A short proof of concept on your own traffic is the best way to decide.
Costs depend on trace volume, retention, and whether you self-host or use a managed service. Several vendors offer free tiers with limits, such as a few thousand traces or tens of thousands of spans per month. Agent workflows generate many spans per action, so volume can grow quickly. Sampling and shorter retention are the main ways to control spend.
Storing them makes debugging far easier, but it creates privacy and compliance obligations. Prompts often contain personal or confidential data that falls under regulations such as the GDPR. A common compromise is to redact sensitive fields, restrict access, and set short retention for raw text. Some teams self-host their tracing backend to keep payloads inside their own network.
Traces preserve the exact context the model saw, so reviewers can check whether the retrieved documents supported the answer. If the right document was missing, the fix lies in retrieval rather than in the model. If the document was present but ignored, the prompt or context order may need work. Failure traces can also become regression tests for future changes.
Monitor each reasoning step, tool call with its arguments and results, step count, total cost, and final outcome. Watch for loops, repeated identical calls, and context that grows without bound. Alert on cost per task, latency percentiles, and evaluation score drops. A maximum step limit with logging prevents silent runaway behavior.
Evaluations produce scores, and tracing gives those scores a home on the exact run that was judged. You can sample production traces, score them automatically, and chart quality by prompt version or model. Human reviewers can label difficult traces to calibrate automated judges. The combination turns observability from passive logging into a quality improvement loop.
Basic automatic instrumentation for a model provider or framework often takes under a day. Adding custom spans, metadata, and privacy controls takes longer, usually a few days of focused work. Evaluation and alerting mature over several weeks as you gather real data. Starting small and validating with real traces avoids large rework later.
Well designed tracing exports data asynchronously, so the overhead on request latency is usually small. Large payloads and synchronous exporters can add measurable delay, so batching and truncation matter. Sampling reduces both overhead and cost for high volume services. Test the impact under realistic load before enabling full capture in production.
Ownership should be explicit, whether it sits with a platform team, an AI reliability group, or a named engineer. Product and data teams should share access to the same dashboards. Finance benefits from cost views, and security benefits from trace based alerts. A written responsibility list prevents the common situation where everyone assumes someone else is watching.